Anubis OSS v2
Real-time LLM benchmarking and hardware telemetry for Apple Silicon
The only native macOS tool that correlates inference performance with GPU, CPU, power, and memory metrics in real time.
Why Anubis?
The local LLM ecosystem on macOS is fragmented. Chat wrappers focus on conversation, monitors are CLI-only, and nothing correlates hardware with inference.
Features
Everything you need to benchmark, compare, and understand local LLM performance on your Mac.
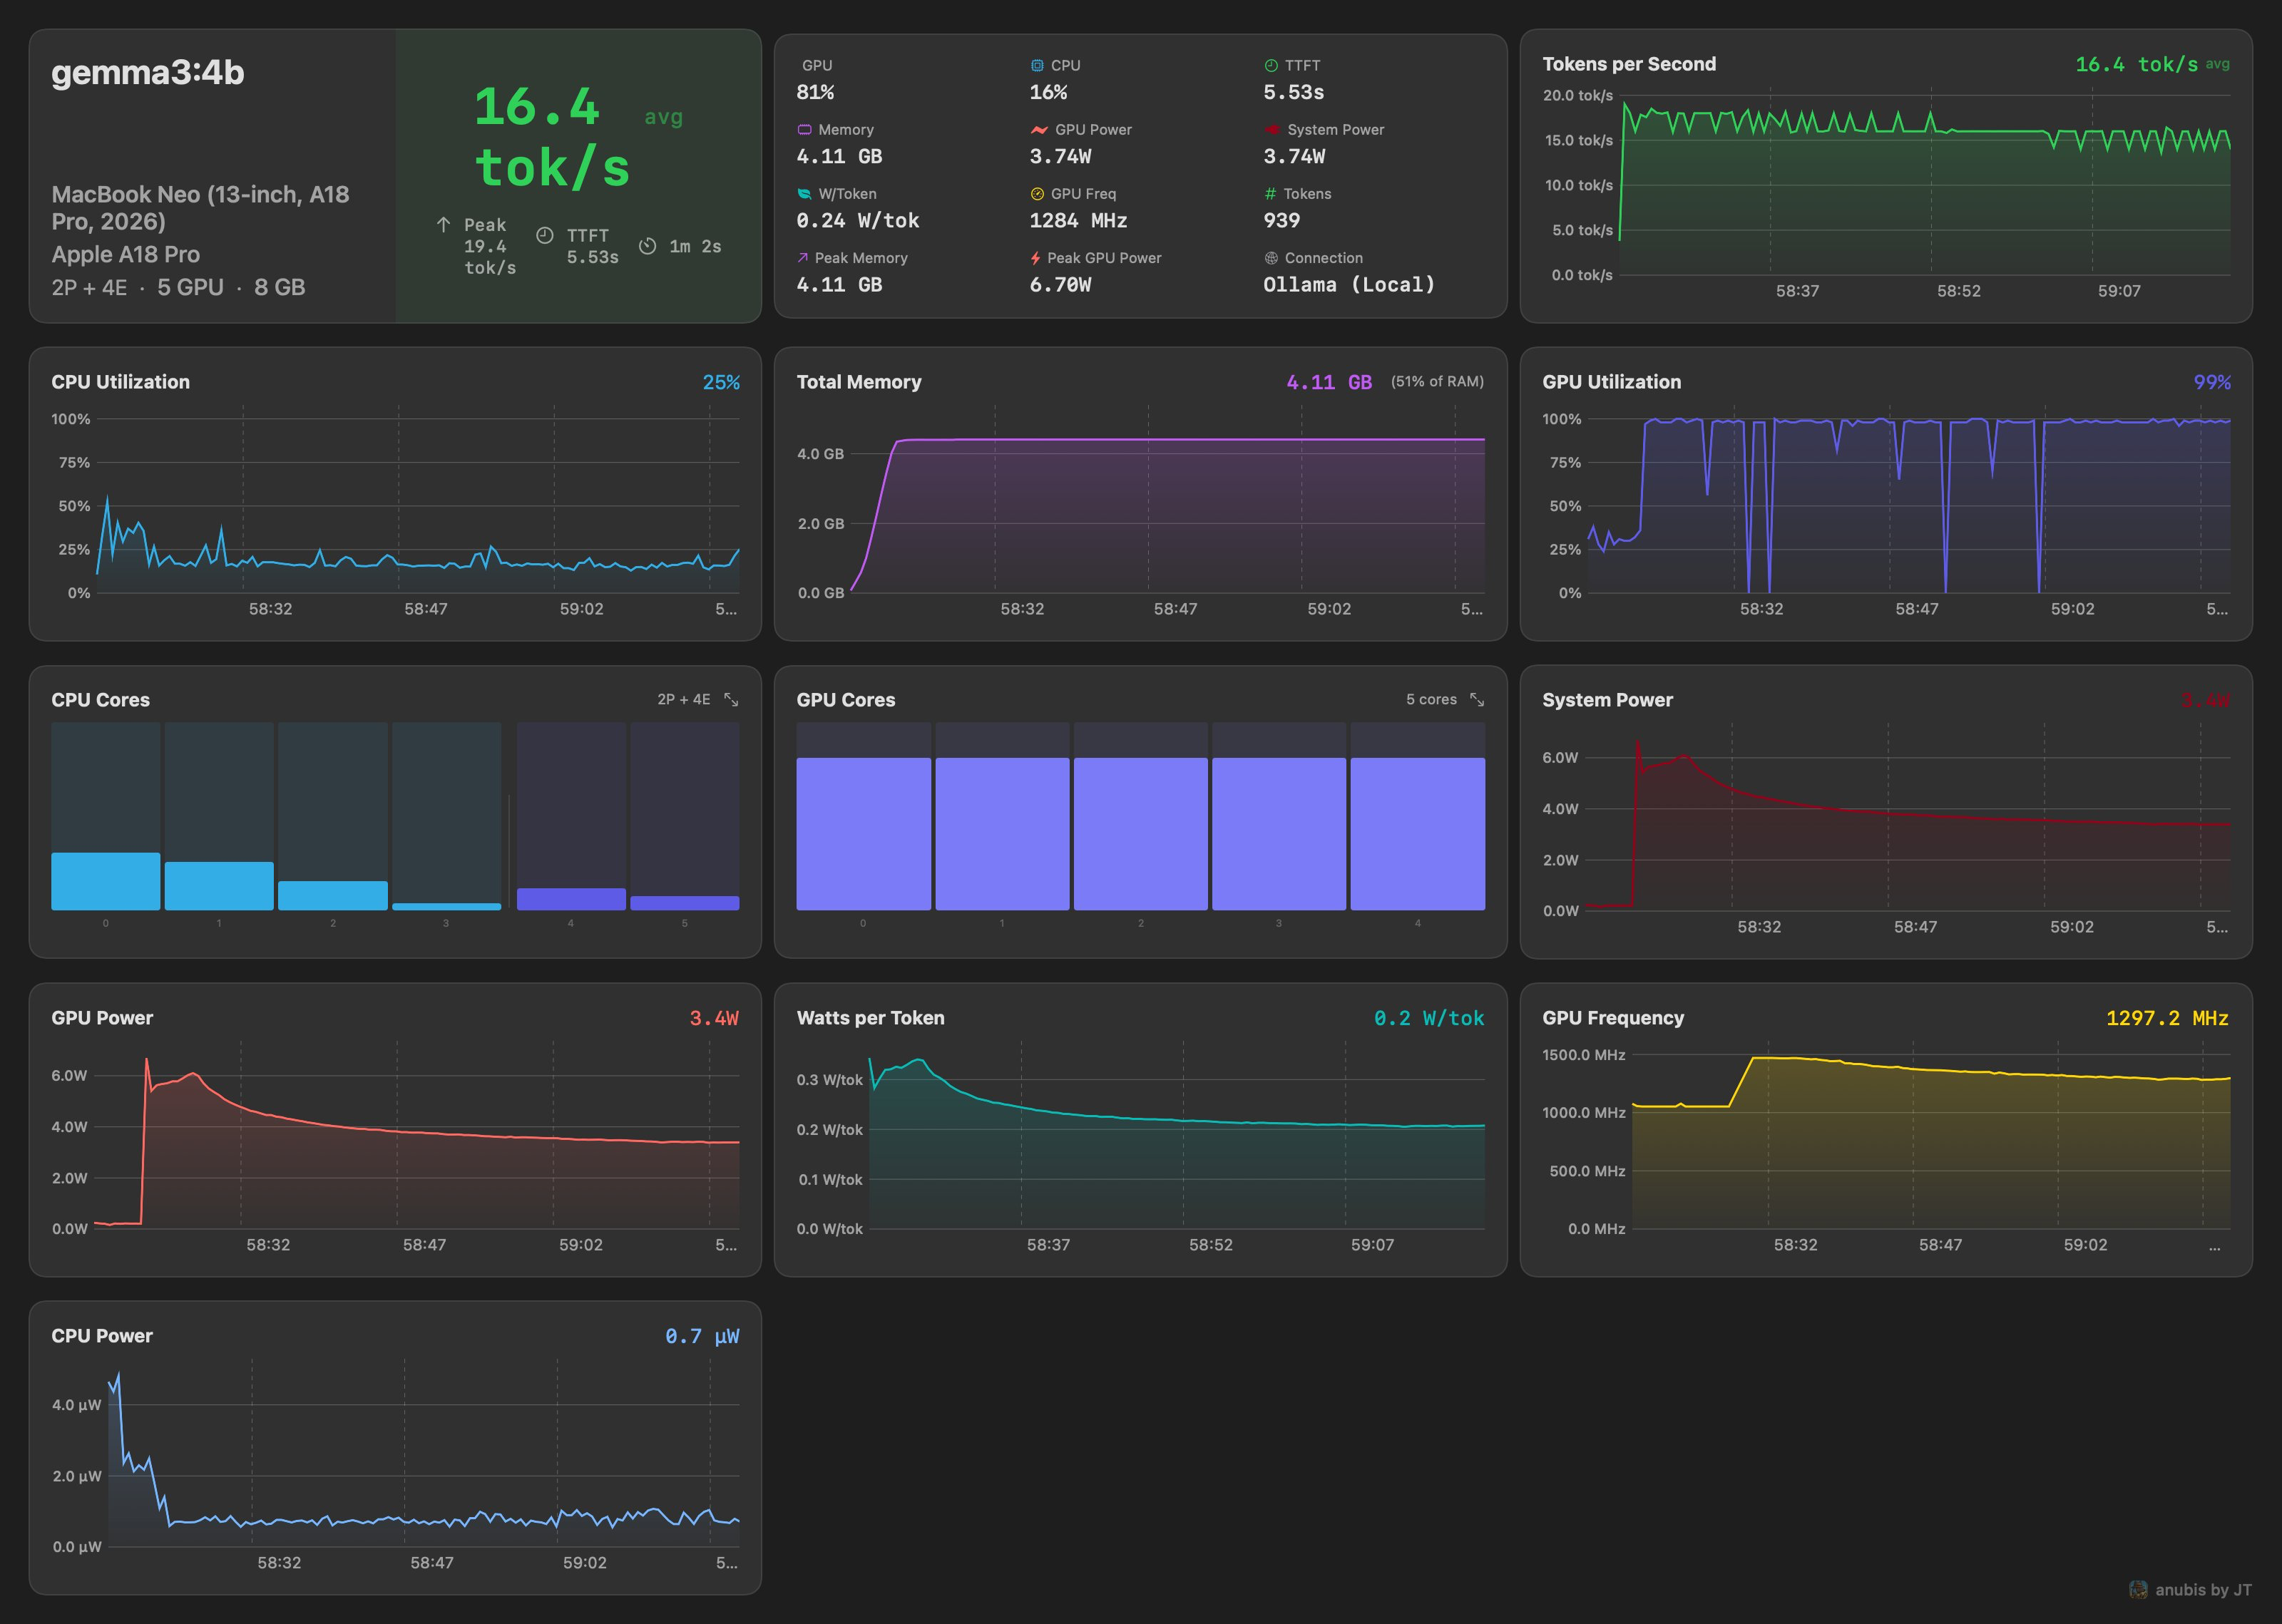
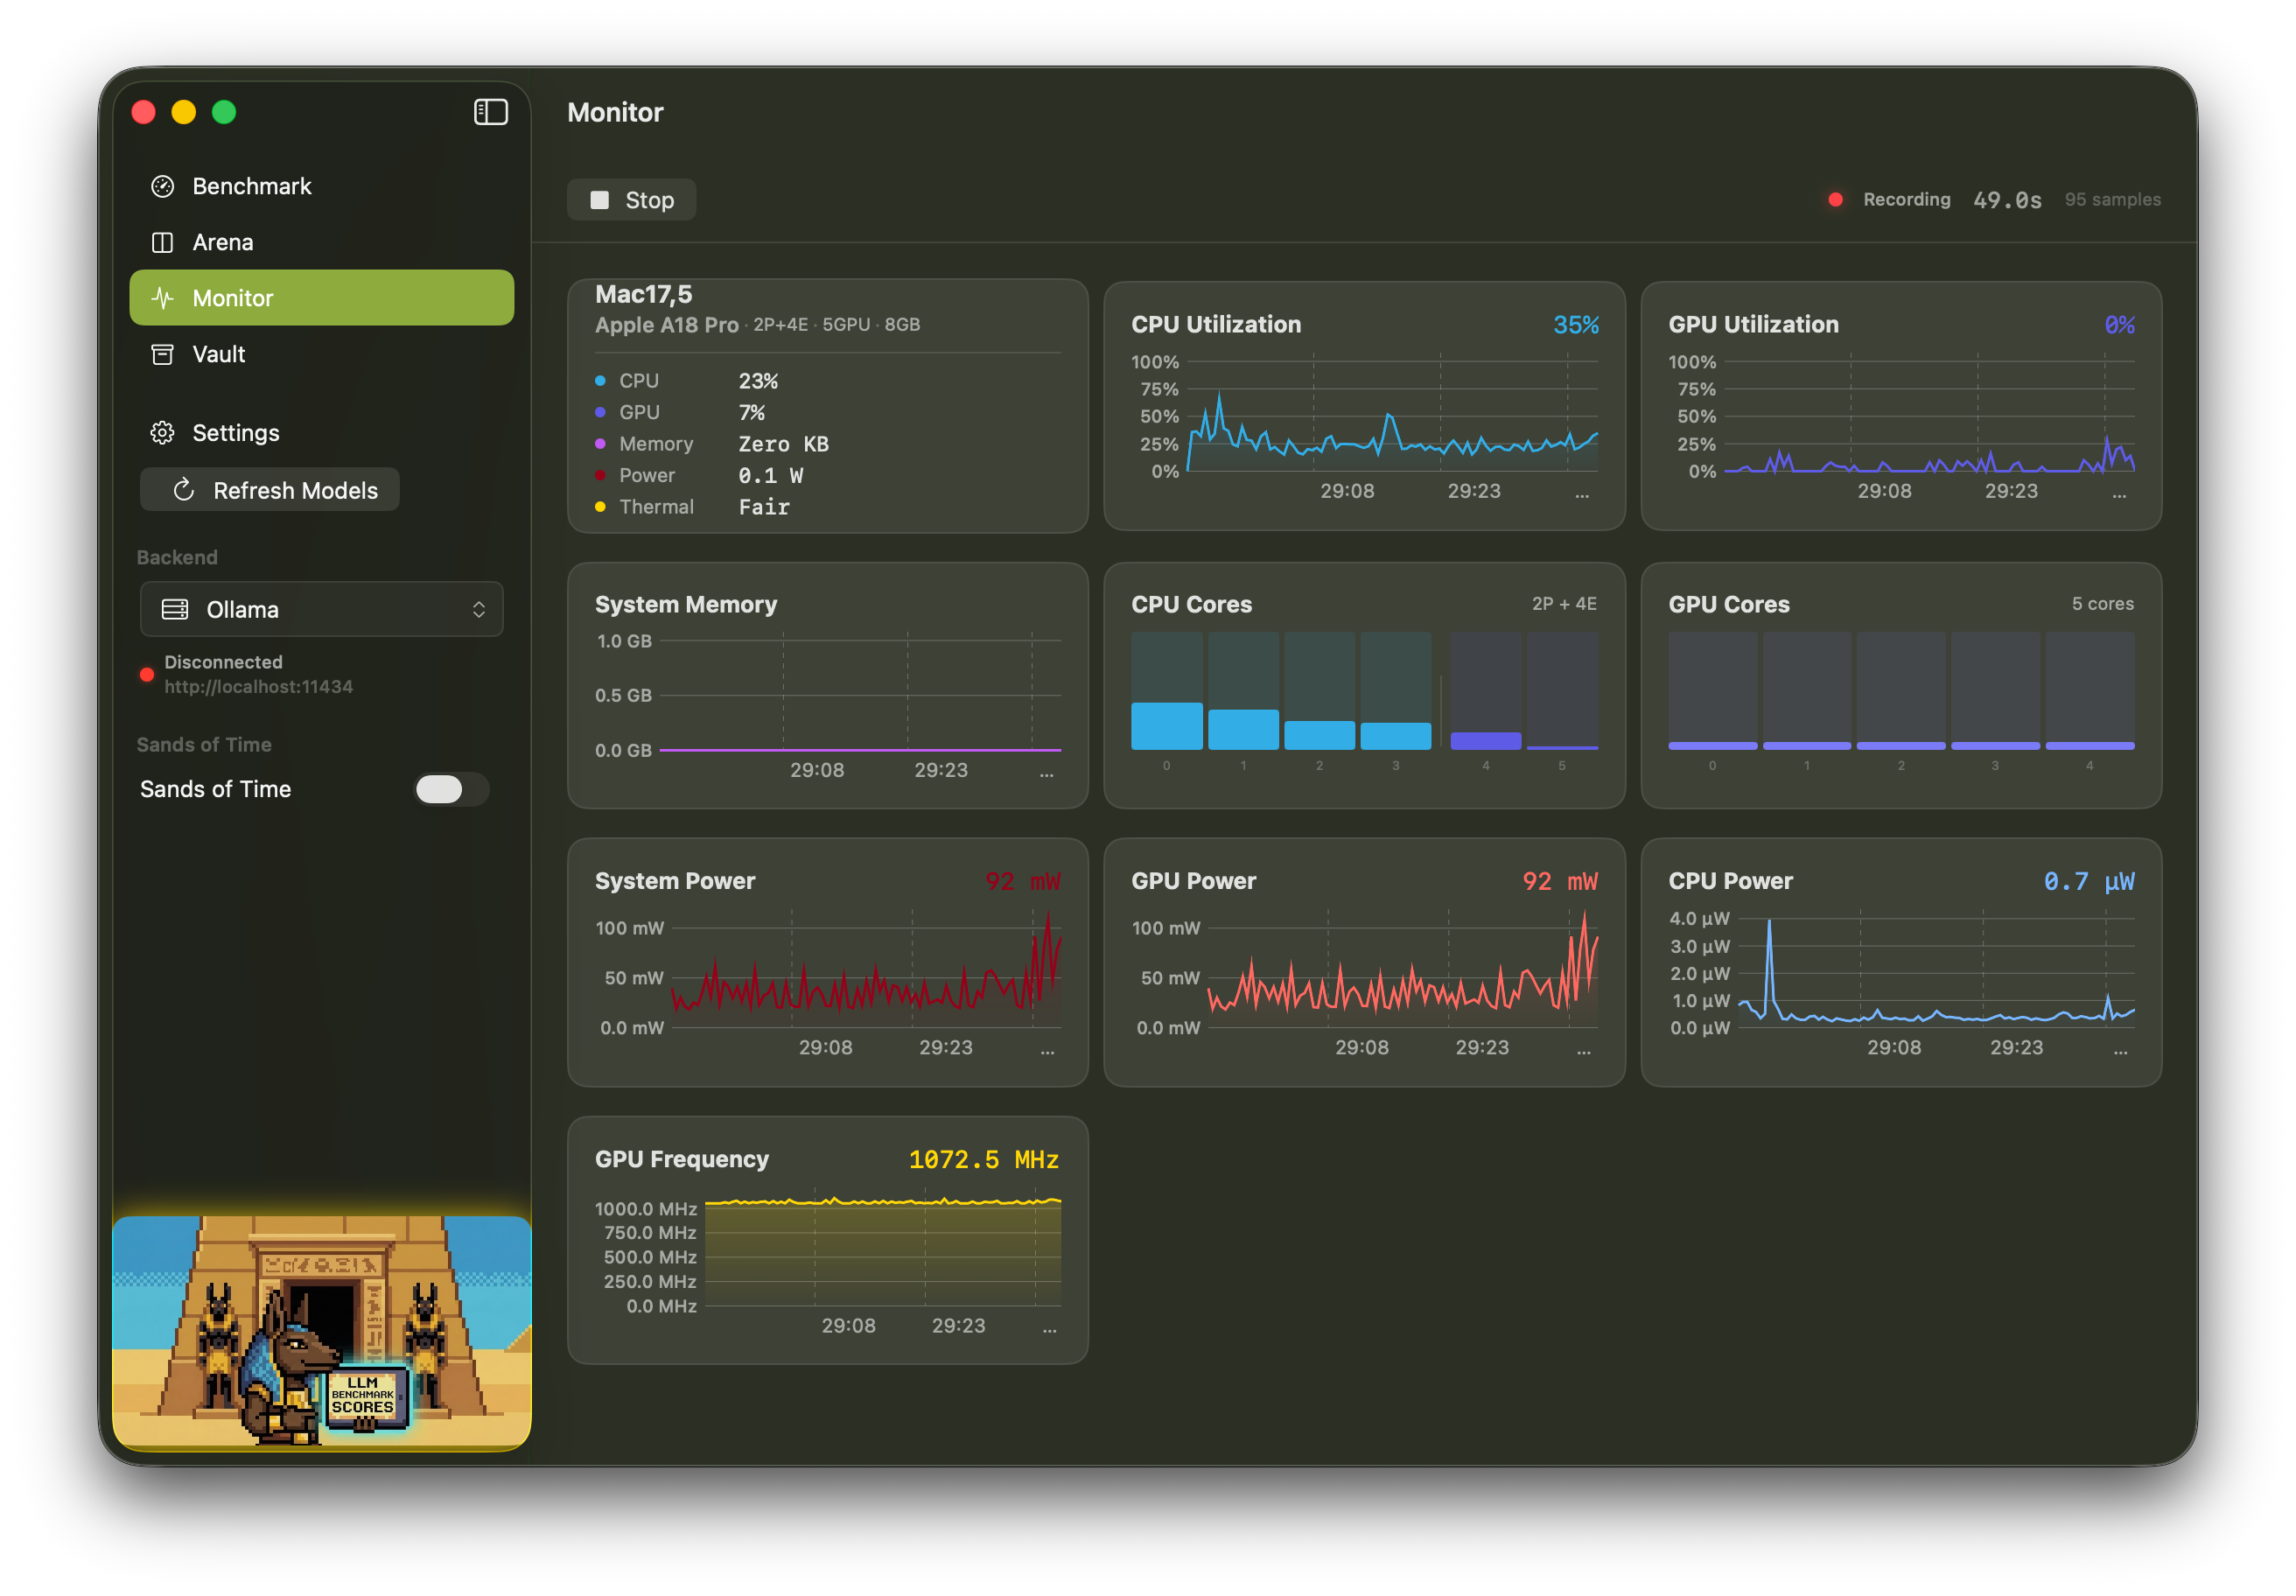
Benchmark Dashboard
Real-time dashboard with 8+ metric cards, 30 data points, 11 live charts, power telemetry, and configurable prompt presets. Exportable and comparable results and reports. Stream responses with live hardware overlay.
Arena Mode
Side-by-side A/B model comparison with sequential or parallel execution. Vote for a winner -; results are persisted with full stats.
Vault
Unified model management across all backends. Pull, delete, inspect, and unload models. Auto-enriched metadata from HuggingFace.
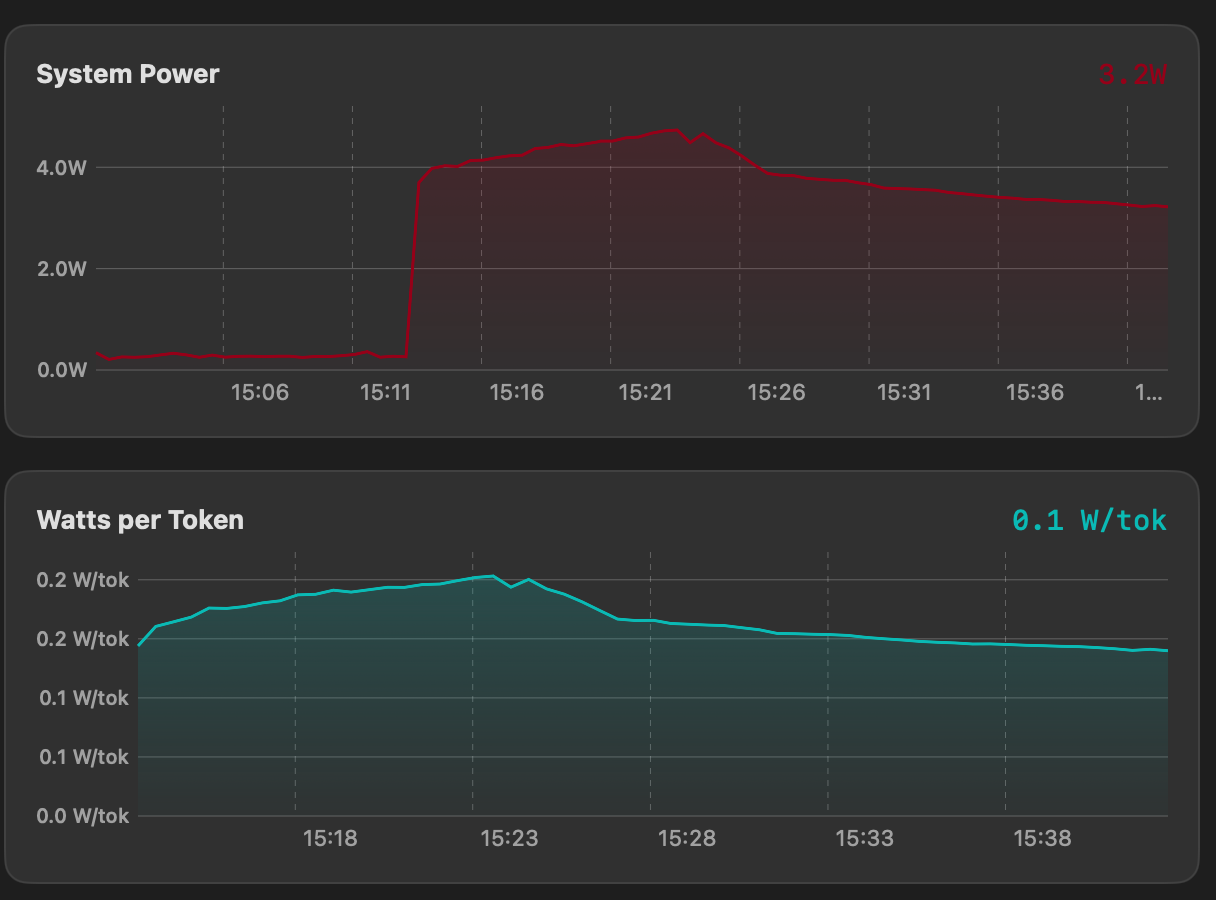
Power Telemetry
GPU, CPU, ANE, and DRAM power in watts via IOReport. See watts-per-token efficiency and compare quantizations by actual power cost.
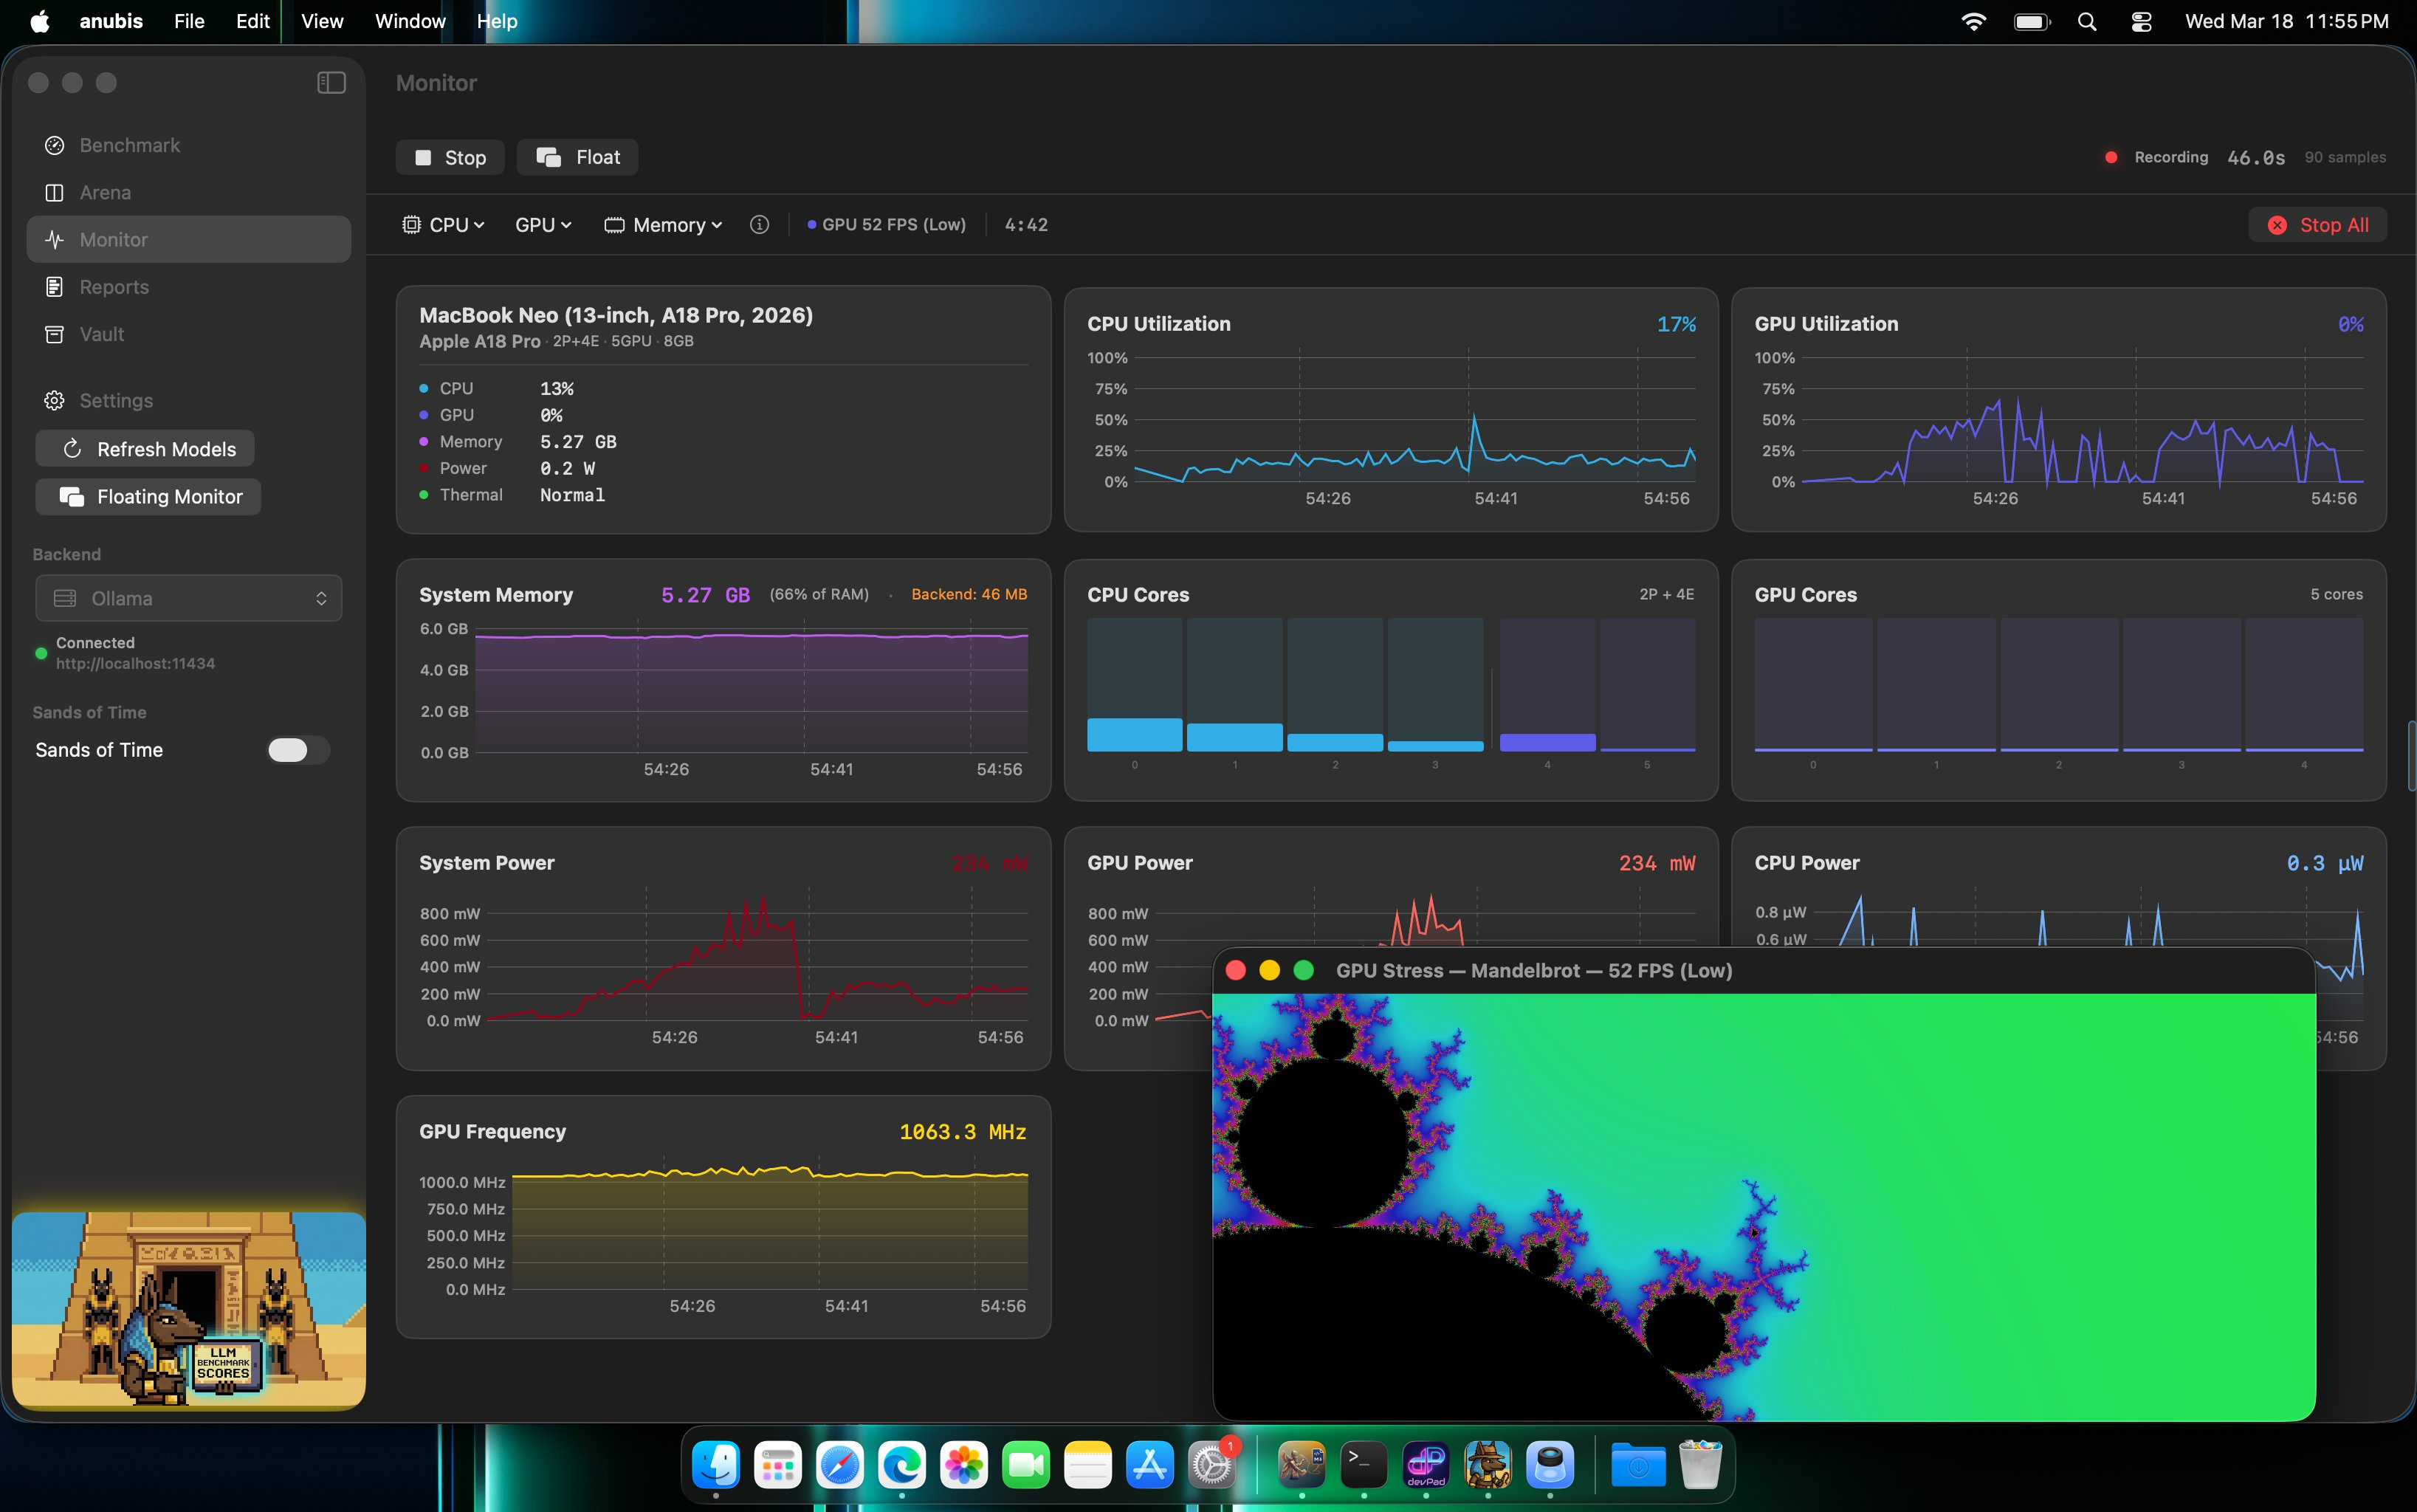
Process Monitoring
Auto-detects backend process by port. Tracks real memory footprint including Metal/GPU allocations. Manual override available.
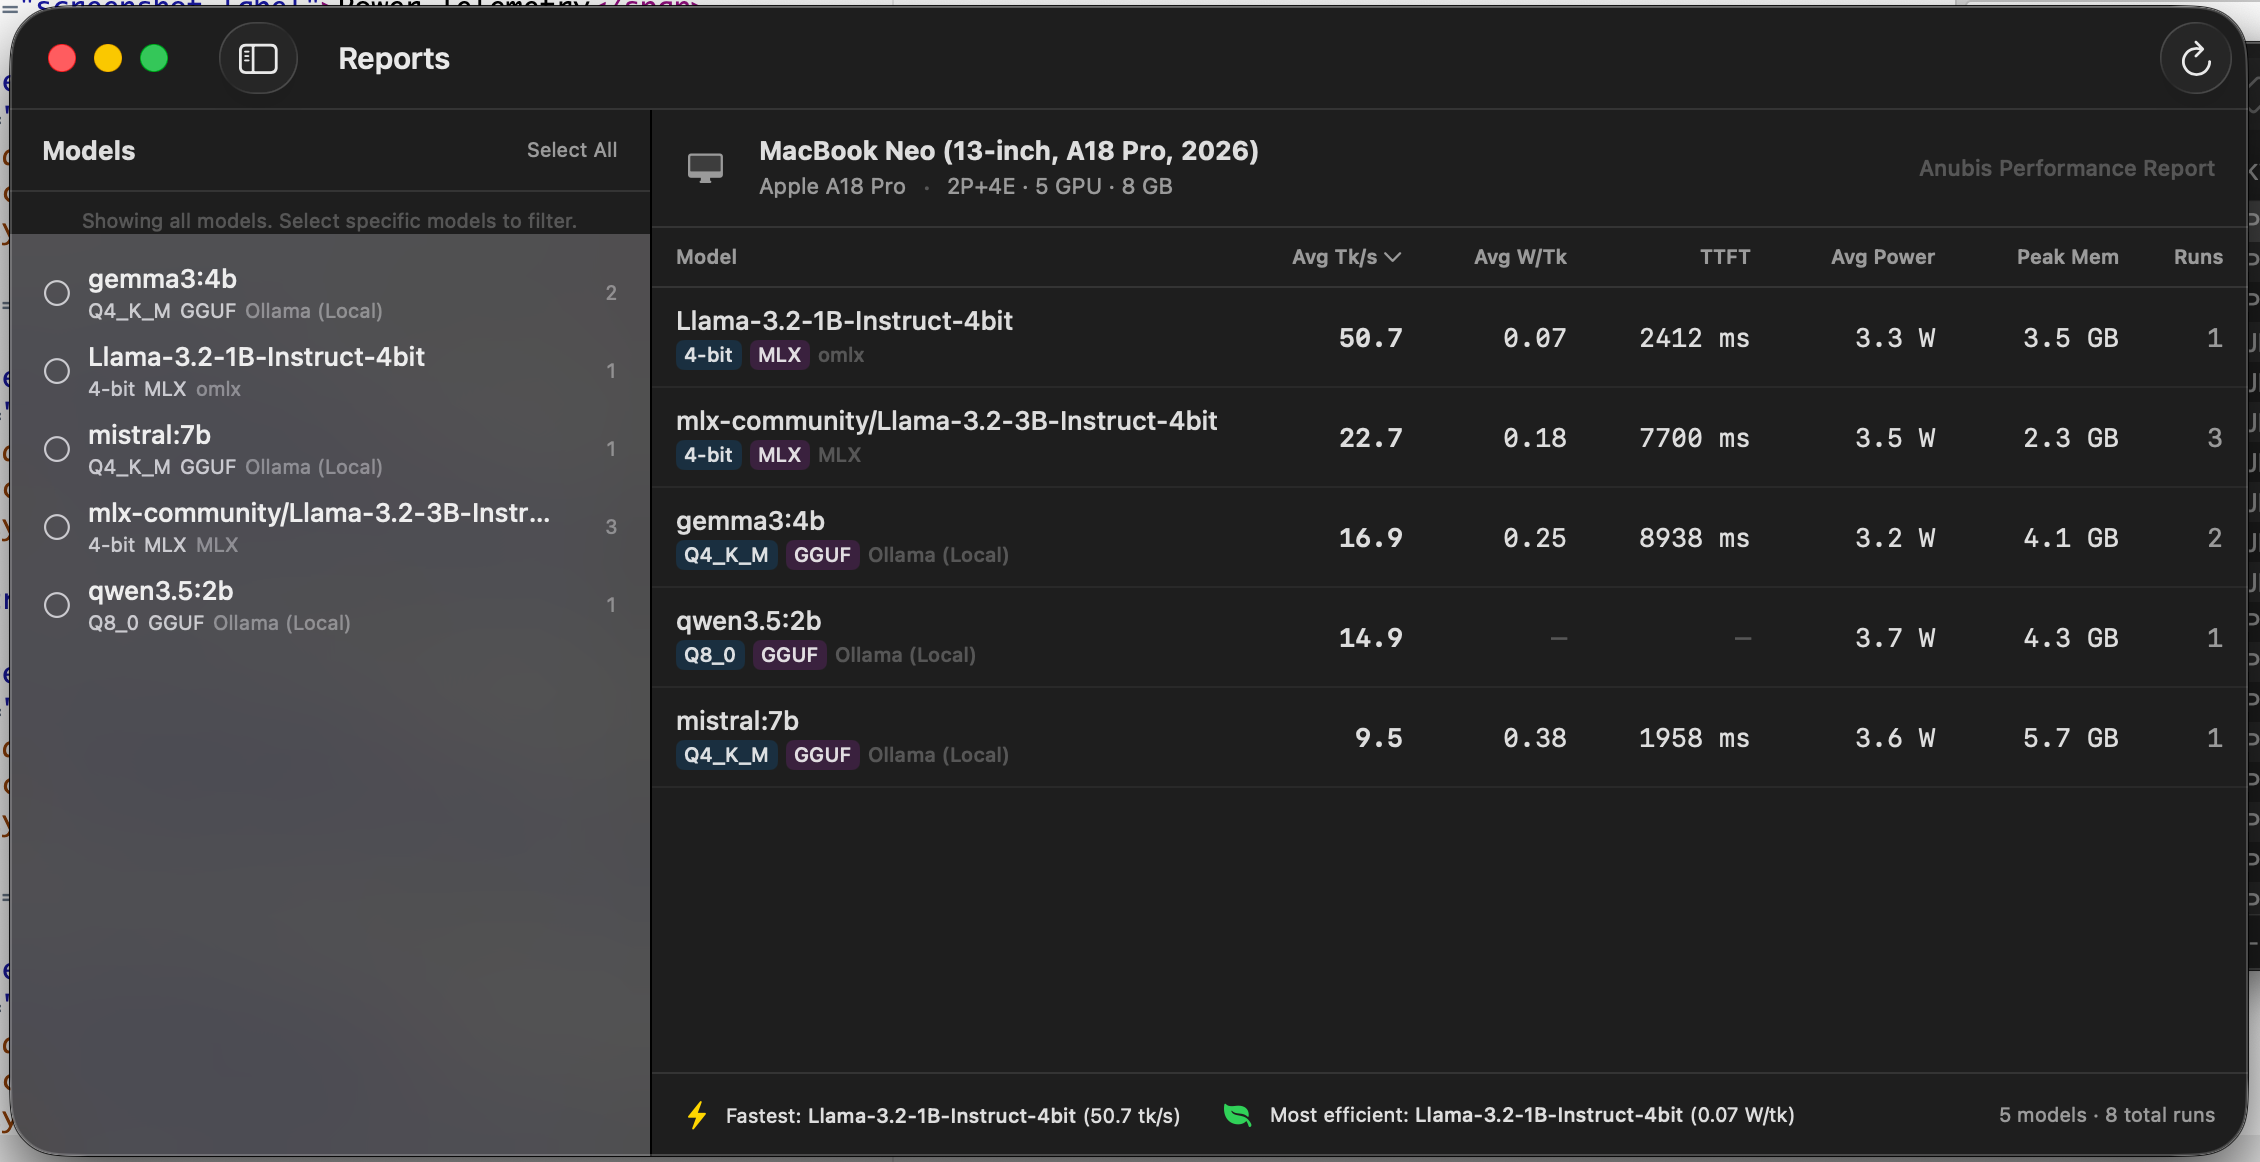
Export & History
Full session history with replay. Export as CSV, Markdown, or shareable 2x retina PNG. Respects light and dark mode.
Supported Backends
Works with any OpenAI-compatible inference endpoint -; local or remote.
Hardware Metrics
Nine telemetry channels sampled in real time via IOReport and system APIs.
| Metric | Source | Description |
|---|---|---|
| GPU Utilization | IOReport | GPU active residency percentage |
| CPU Utilization | host_processor_info | Usage across all cores |
| GPU Power | IOReport Energy Model | GPU power consumption in watts |
| CPU Power | IOReport Energy Model | CPU (E + P cores) power in watts |
| ANE Power | IOReport Energy Model | Neural Engine power consumption |
| DRAM Power | IOReport Energy Model | Memory subsystem power |
| GPU Frequency | IOReport GPU Stats | Weighted average from P-state residency |
| Process Memory | proc_pid_rusage | Backend phys_footprint (incl. Metal/GPU) |
| Thermal State | ProcessInfo | System thermal pressure level |
Requirements
Try Anubis OSS
Free, open source, and notarized. Download the app or build from source.