devPad Guide
A slide-out utility panel for macOS that gives you instant access to a browser, code viewer, AI chat, and developer tools - all triggered by moving your cursor to the screen edge.
$ Move cursor to screen edge to reveal | Move away to hide | Cmd+Shift+. to toggle anywhere
Getting Started
devPad is designed to stay out of your way until you need it. Here's how to get started:
Revealing the Panel
There are three ways to show devPad:
- Move your cursor to the screen edge (left or right, depending on your settings). The panel slides out automatically.
- Press Cmd+Shift+. from anywhere to toggle the panel.
- Click the menu bar icon if you've enabled it in settings.
Hiding the Panel
The panel hides automatically when you move your mouse away (unless you've disabled auto-hide). You can also:
- Press Cmd+Shift+. to hide immediately
- Click outside the panel
- Disable auto-hide in the gear menu to keep the panel visible
Tip: Pin the panel open by clicking the pin icon in the toolbar, or disable "Auto-Hide When Mouse Leaves" in the gear menu for persistent visibility.
First-Time Setup
When you first launch devPad, the Setup Wizard walks you through:
- Panel side - Choose left or right edge trigger
- Panel size - Select from Narrow, Medium, Wide, or custom sizes
- Theme - Pick from 25+ color themes
- Toolbar style - Full toolbar or compact floating grid
You can re-run the wizard anytime from the gear menu > "Run Setup Wizard".
Compact Toolbar Mode
Prefer a cleaner look? Switch to compact mode for a floating tool grid instead of the full toolbar. Toggle in the gear menu or during setup.
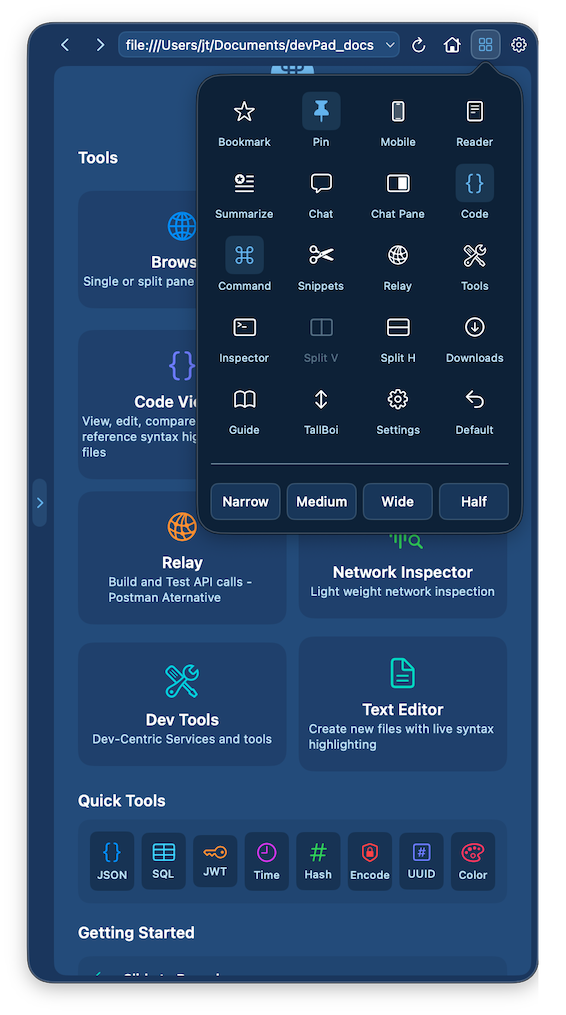
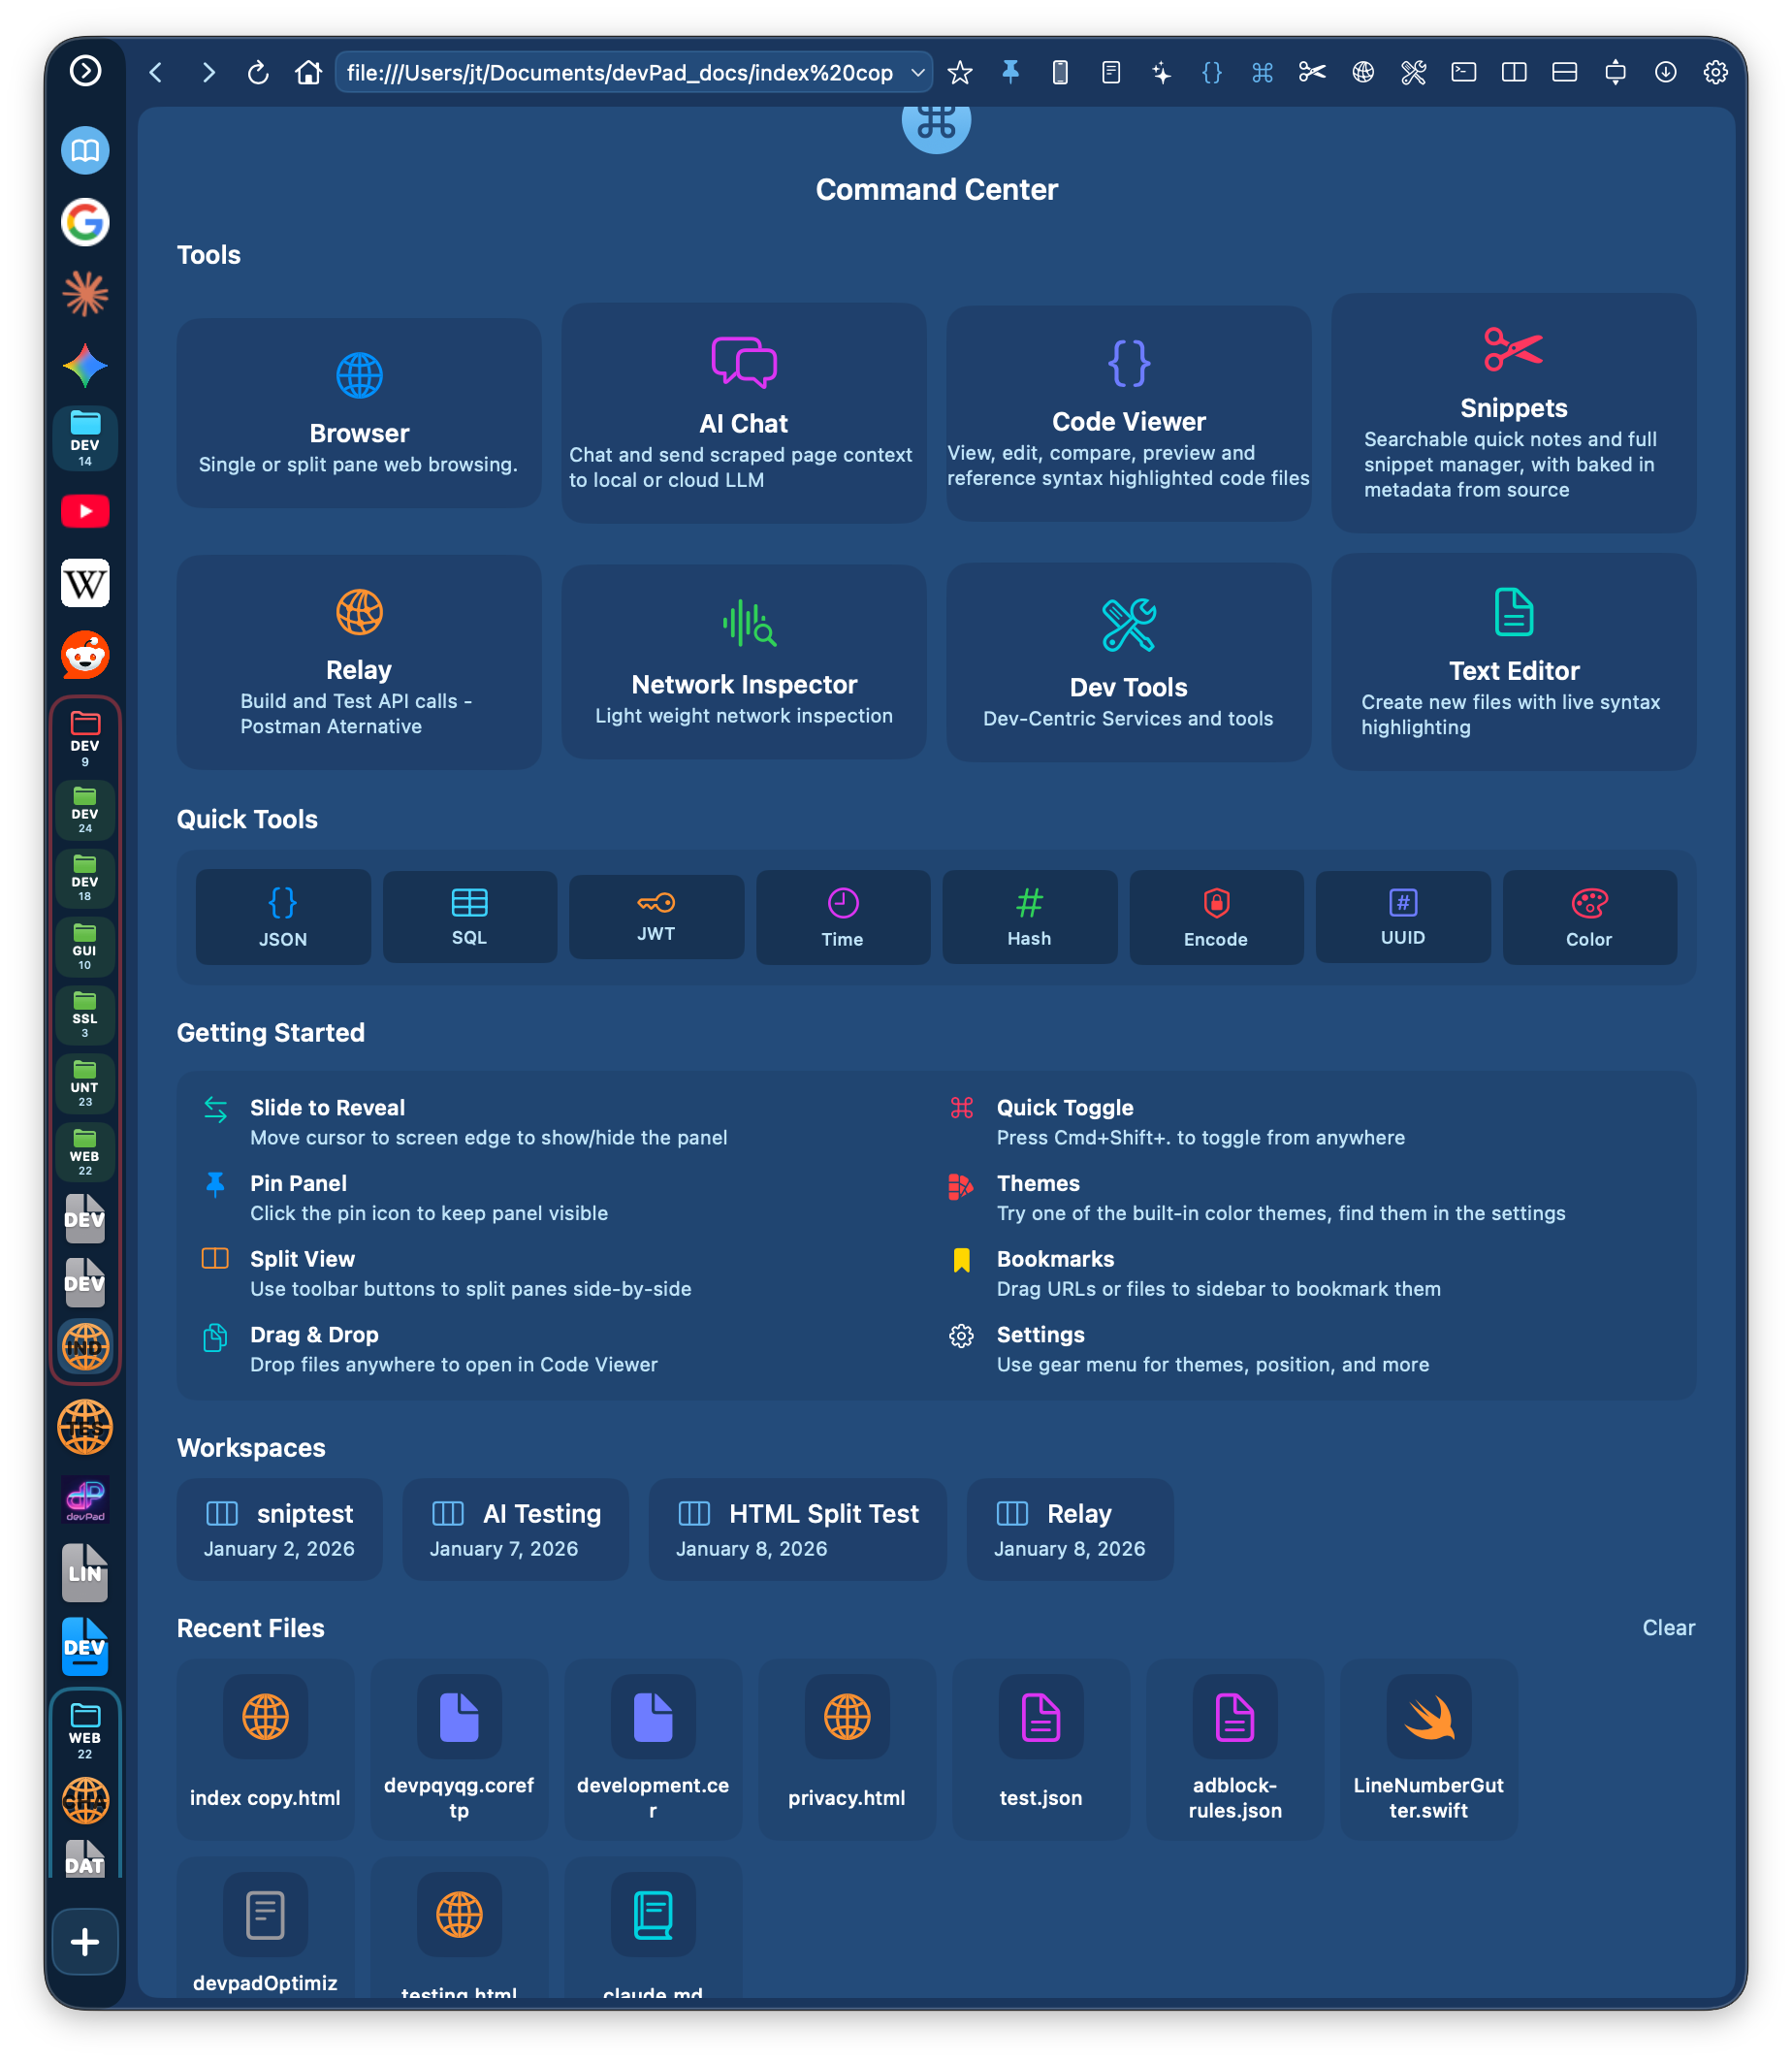
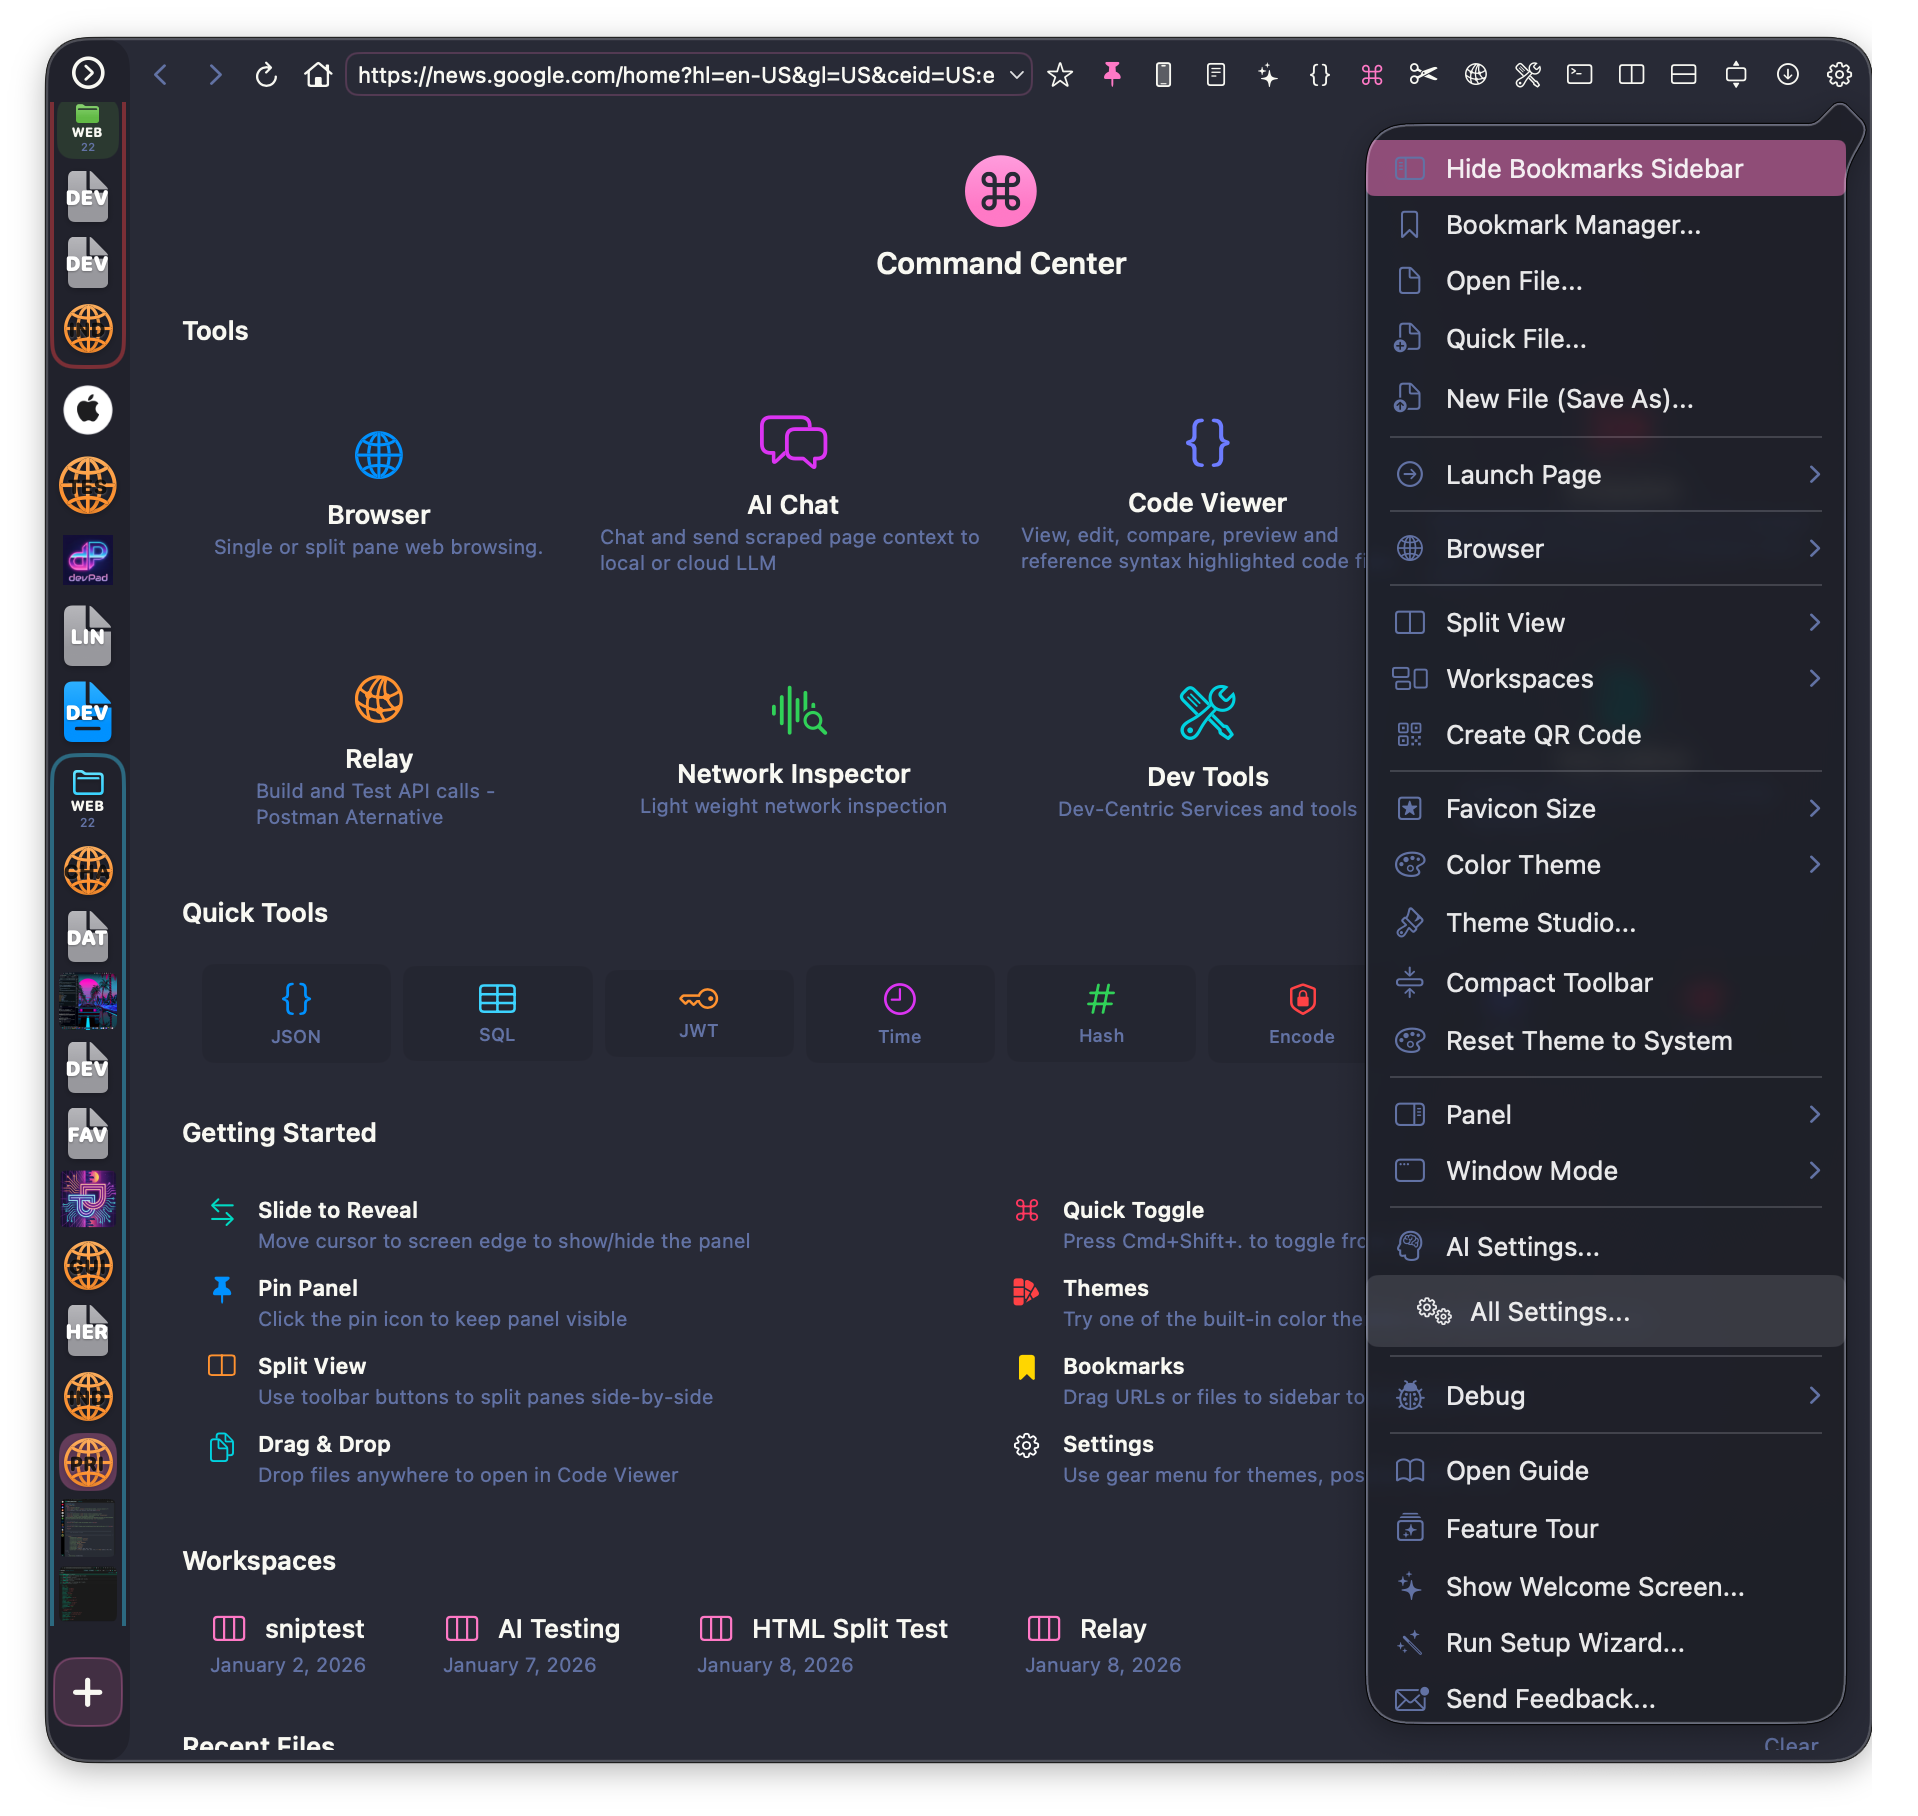
Command Center
Click the grid icon in the toolbar to open Command Center - a quick launcher for jumping to any tool, workspace, or recent file without navigating menus.
Browser
A full-featured web browser built into the slide-out panel. It's designed for quick lookups, documentation, and web tools without leaving your current workspace.
Basic Navigation
The URL bar at the top accepts both URLs and search queries:
- Type a URL (e.g.,
github.com) and press Enter to navigate - Type a search query (e.g.,
swift string formatting) to search with your chosen engine - Use the back/forward buttons to navigate history
- Click the home icon to return to your home page
How to: Set a Home Page
- Navigate to the page you want as your home page
- Open the gear menu (⚙️ icon in toolbar)
- Select "Set Current as Home Page"
- Now clicking the home icon will always take you there
Find in Page
Press Cmd+F to open the find bar. Type your search term and use the arrow buttons (or Enter) to jump between matches. The current match is highlighted, and the match count shows your position.
Bookmarks
The bookmark sidebar (left edge of the browser) gives you quick access to saved pages:
- Click the star icon in the URL bar to bookmark the current page
- Drag bookmarks to reorder them or move into folders
- Right-click to edit, delete, or move bookmarks
- Create folders to organize bookmarks by topic or project
How to: Bookmark a Local Folder
You can bookmark entire folders from your Mac for quick file access:
- Open the Bookmark Manager (gear menu > Bookmark Manager)
- Click "Import Folder"
- Select a folder from Finder
- The folder appears as a bookmark - click to browse its files
How to: Import Bookmarks from Another Browser
Bring your bookmarks from Safari, Chrome, Firefox, Brave, or Edge:
- Export from your browser:
- Safari: File → Export → Bookmarks...
- Chrome/Brave/Edge: ⋮ Menu → Bookmarks → Bookmark Manager → ⋮ → Export bookmarks
- Firefox: Bookmarks → Manage Bookmarks → Import/Backup → Export to HTML
- Save the HTML file to your Downloads folder
- In devPad, open the gear menu and select Import Bookmarks...
- Click "Choose File" and select the exported HTML file
- Preview your bookmarks, then click "Import"
Imported bookmarks are added to your existing bookmarks (nothing is replaced). Favicons are downloaded automatically in the background.
Local Files
devPad can open local files directly:
- Drag and drop files from Finder into the browser
- Use File > Open or Cmd+O
- Supported: PDF, images, HTML, text files, code files, and more
Quick Folder Search
When browsing a local folder (file:// URL), you can instantly search for files:
- Force Click (deep trackpad press) anywhere in the folder to open search
- Right-click the folder background for a context menu with "Search This Folder"
- Type to filter files by name - results update as you type
- Press Enter or click to open the selected file
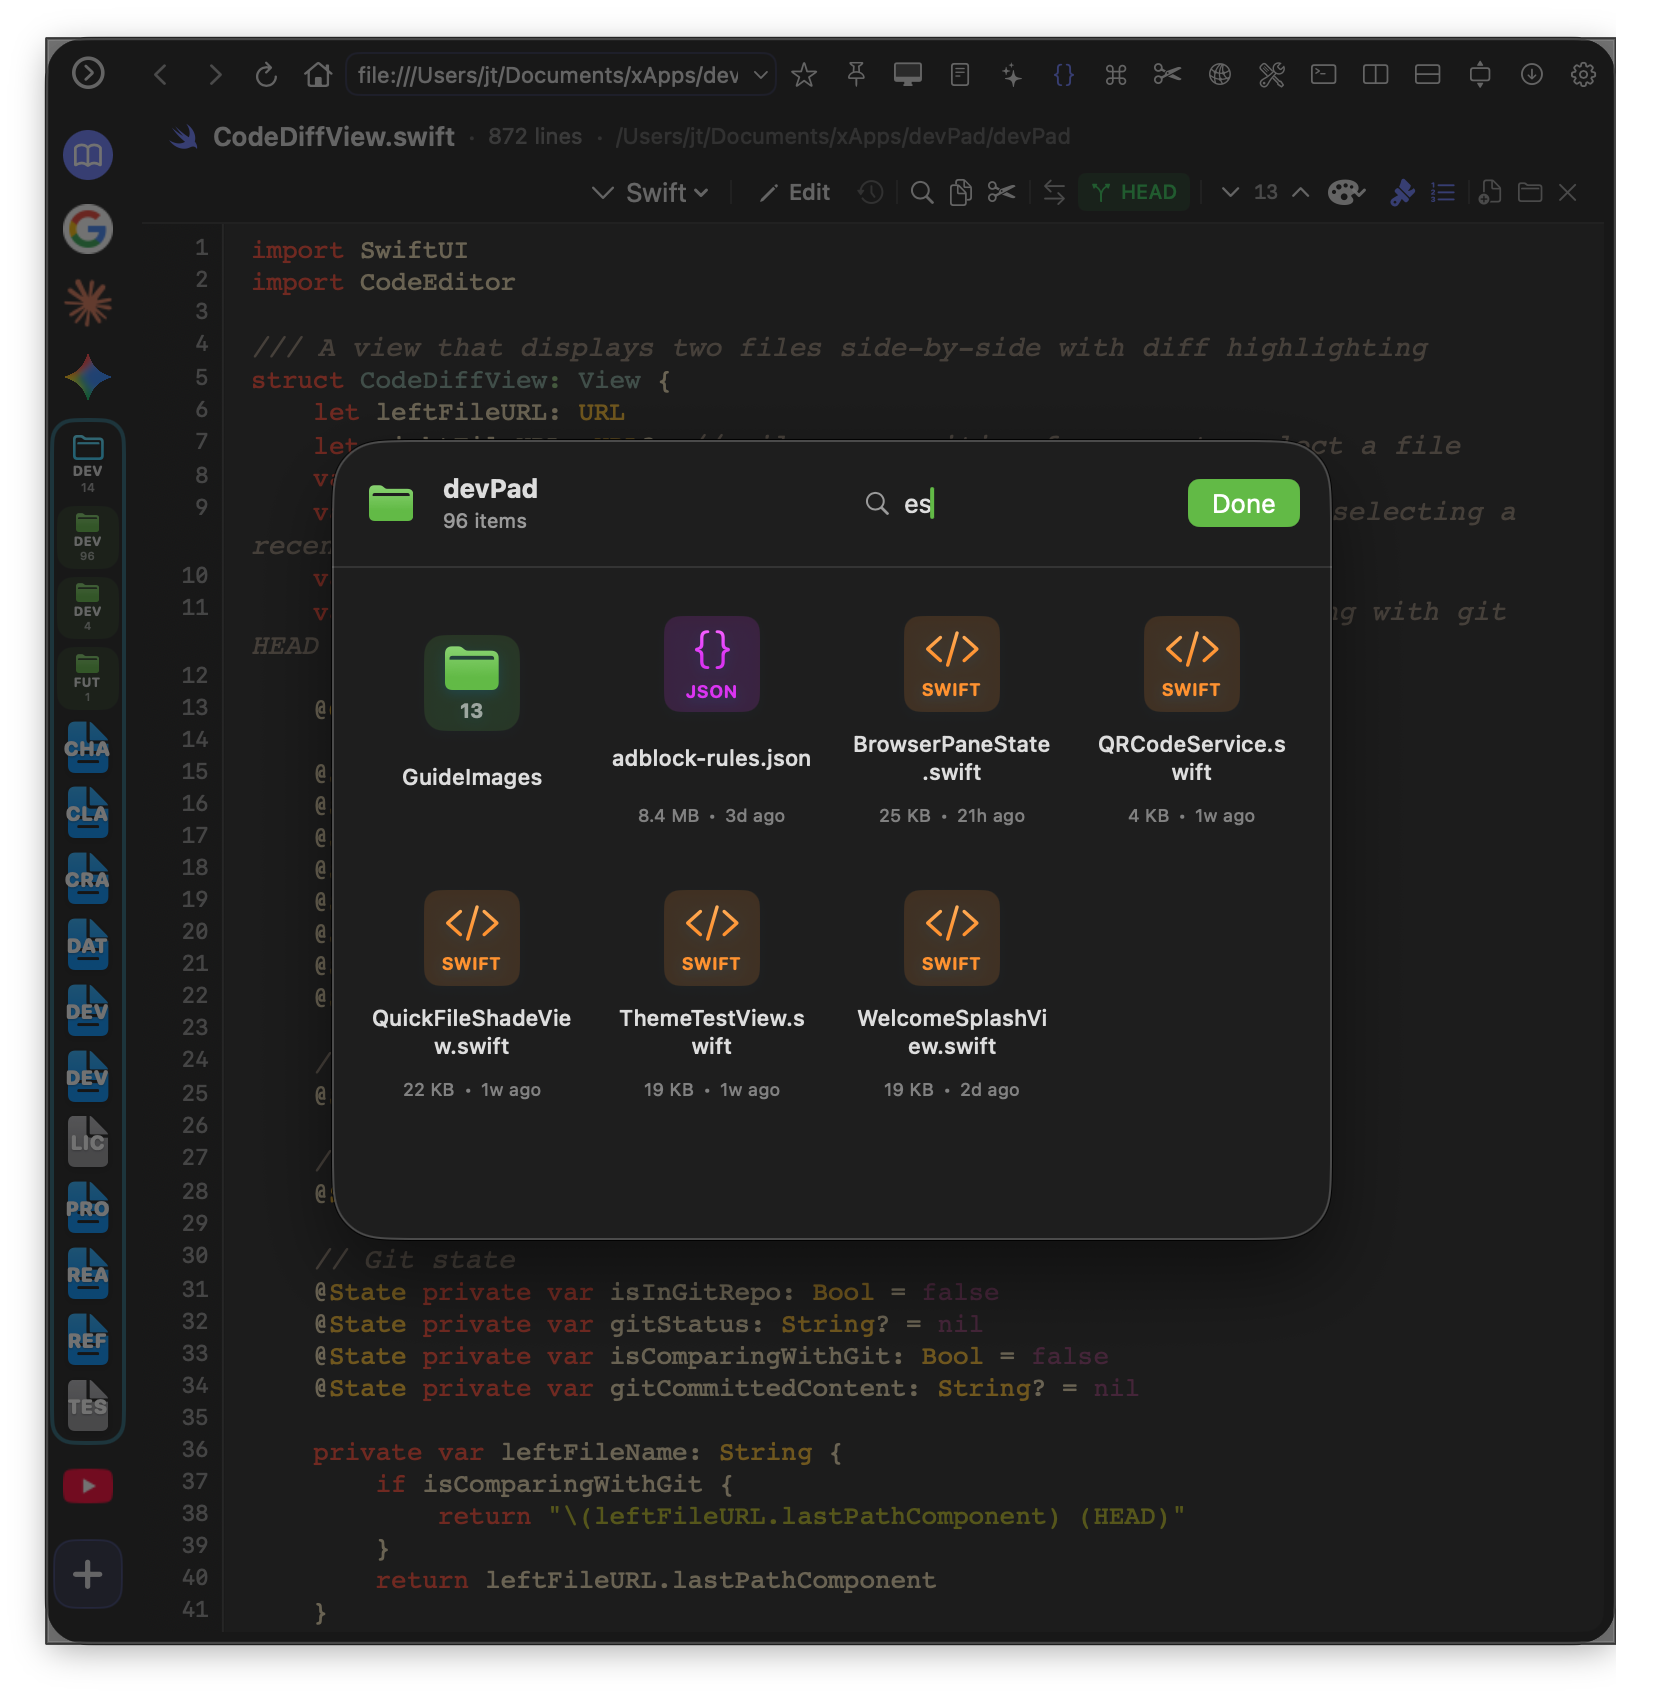
How to: Find Files in Large Project Folders
- Navigate to your project folder in the browser (drag folder or use File > Open)
- Force Click anywhere in the file listing
- Type part of the filename you're looking for
- Press Enter to open the first match, or arrow keys to select others
This is much faster than scrolling through hundreds of files!
User Agent Switching
Some sites serve different content to mobile vs desktop browsers. Click the device icon in the toolbar to switch between:
- Desktop mode - Standard macOS Safari user agent
- Mobile mode - iPhone Safari user agent (useful for responsive testing)
Tip: Mobile mode is great for sites that have better mobile interfaces, or for testing responsive designs.
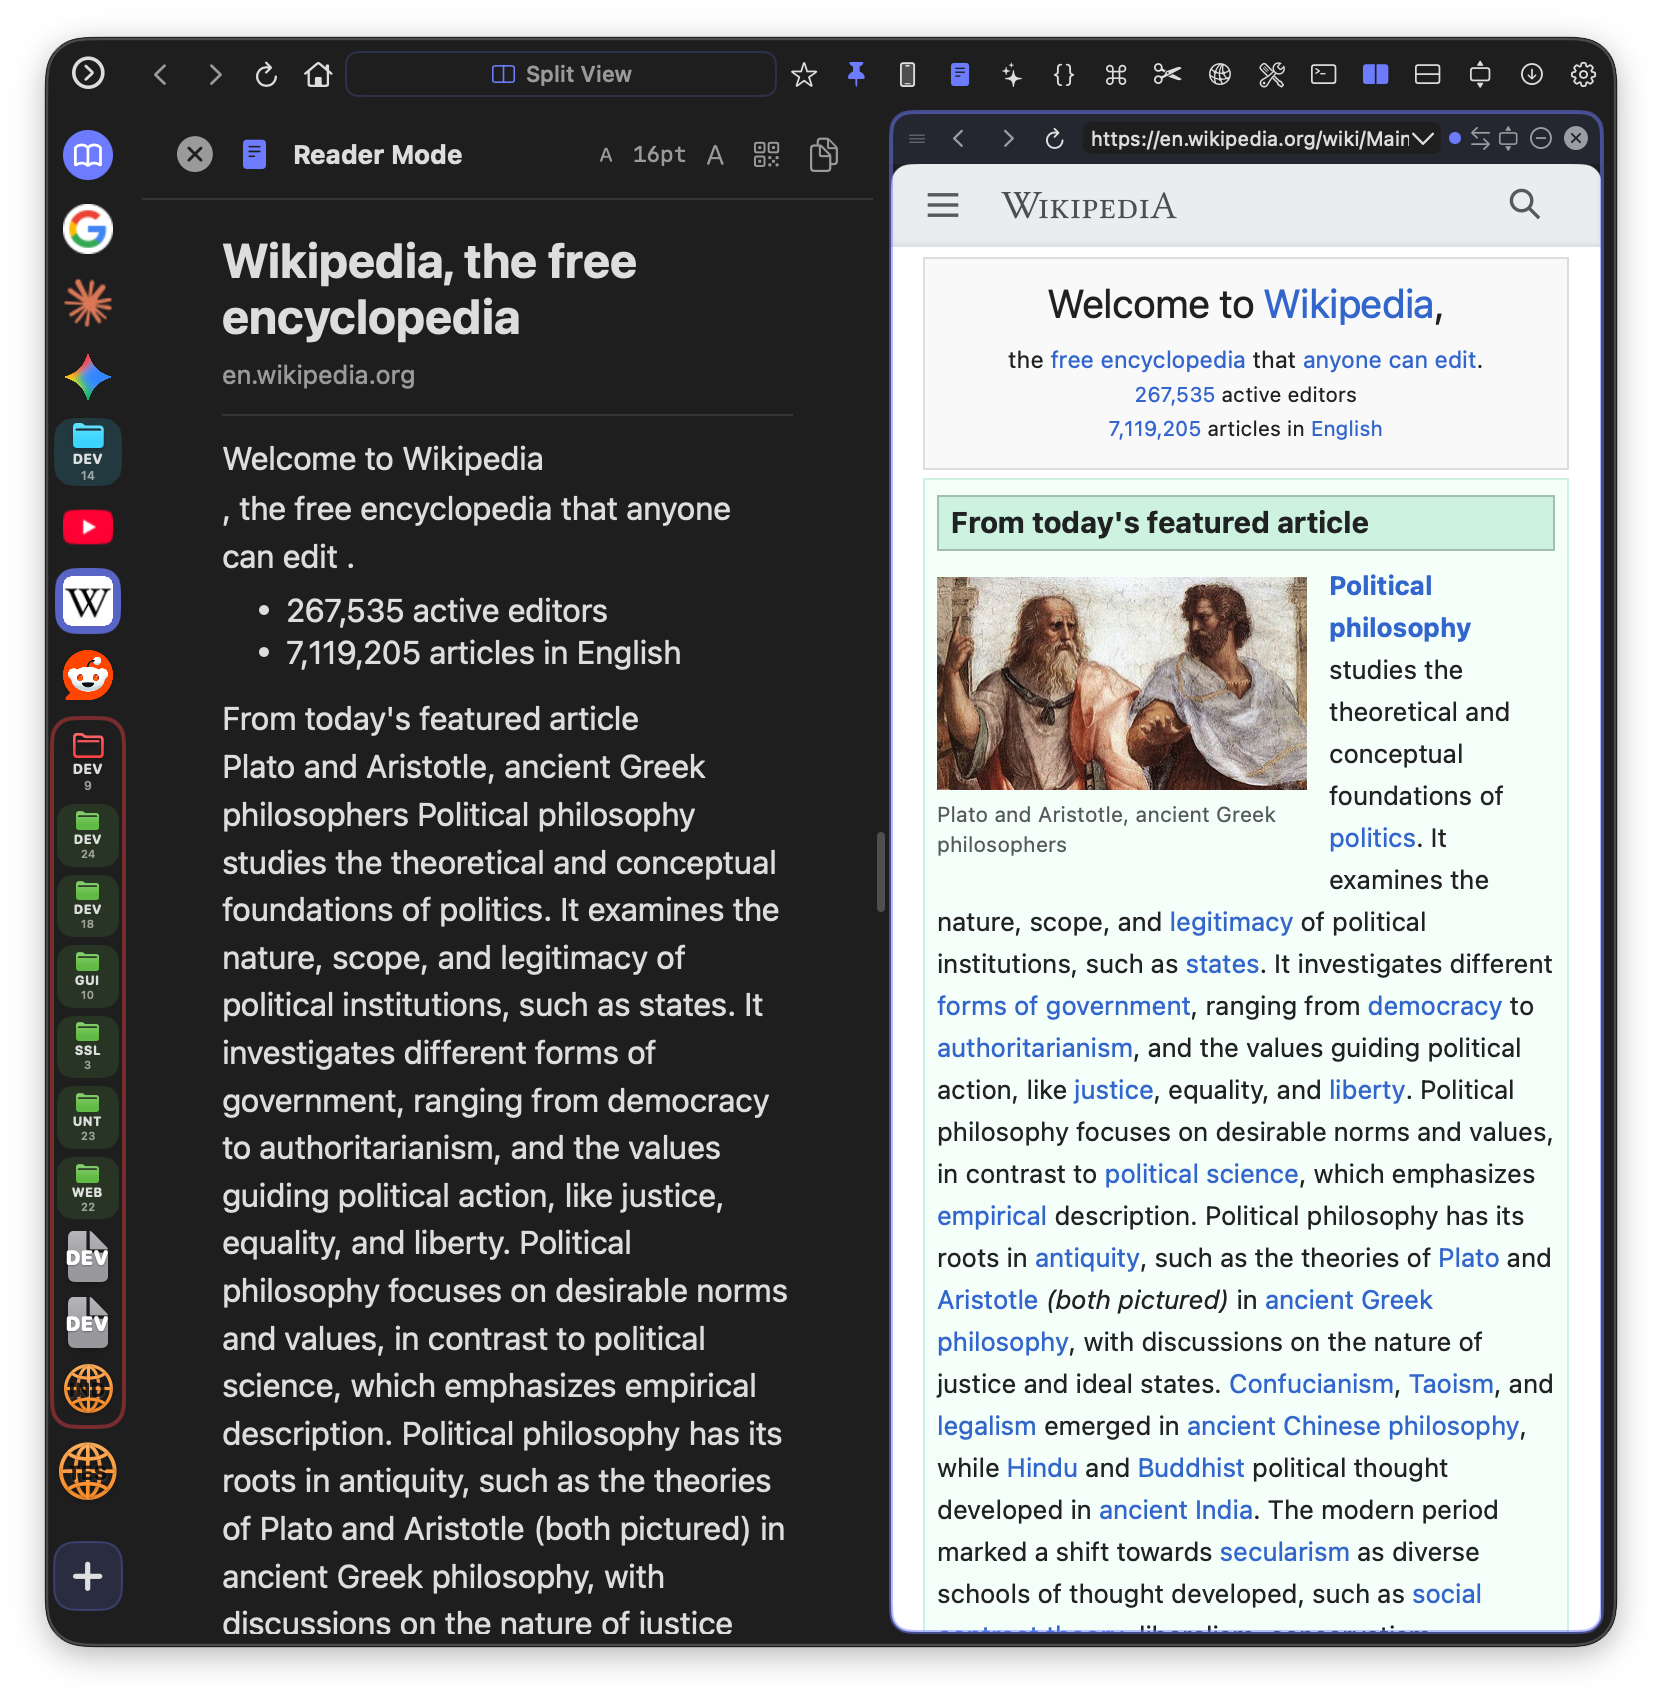
Reader Mode
Click the book icon in the toolbar (or press Cmd+Shift+R) to toggle Reader Mode. This strips away ads, navigation, and clutter to show just the article content in a clean, readable format.
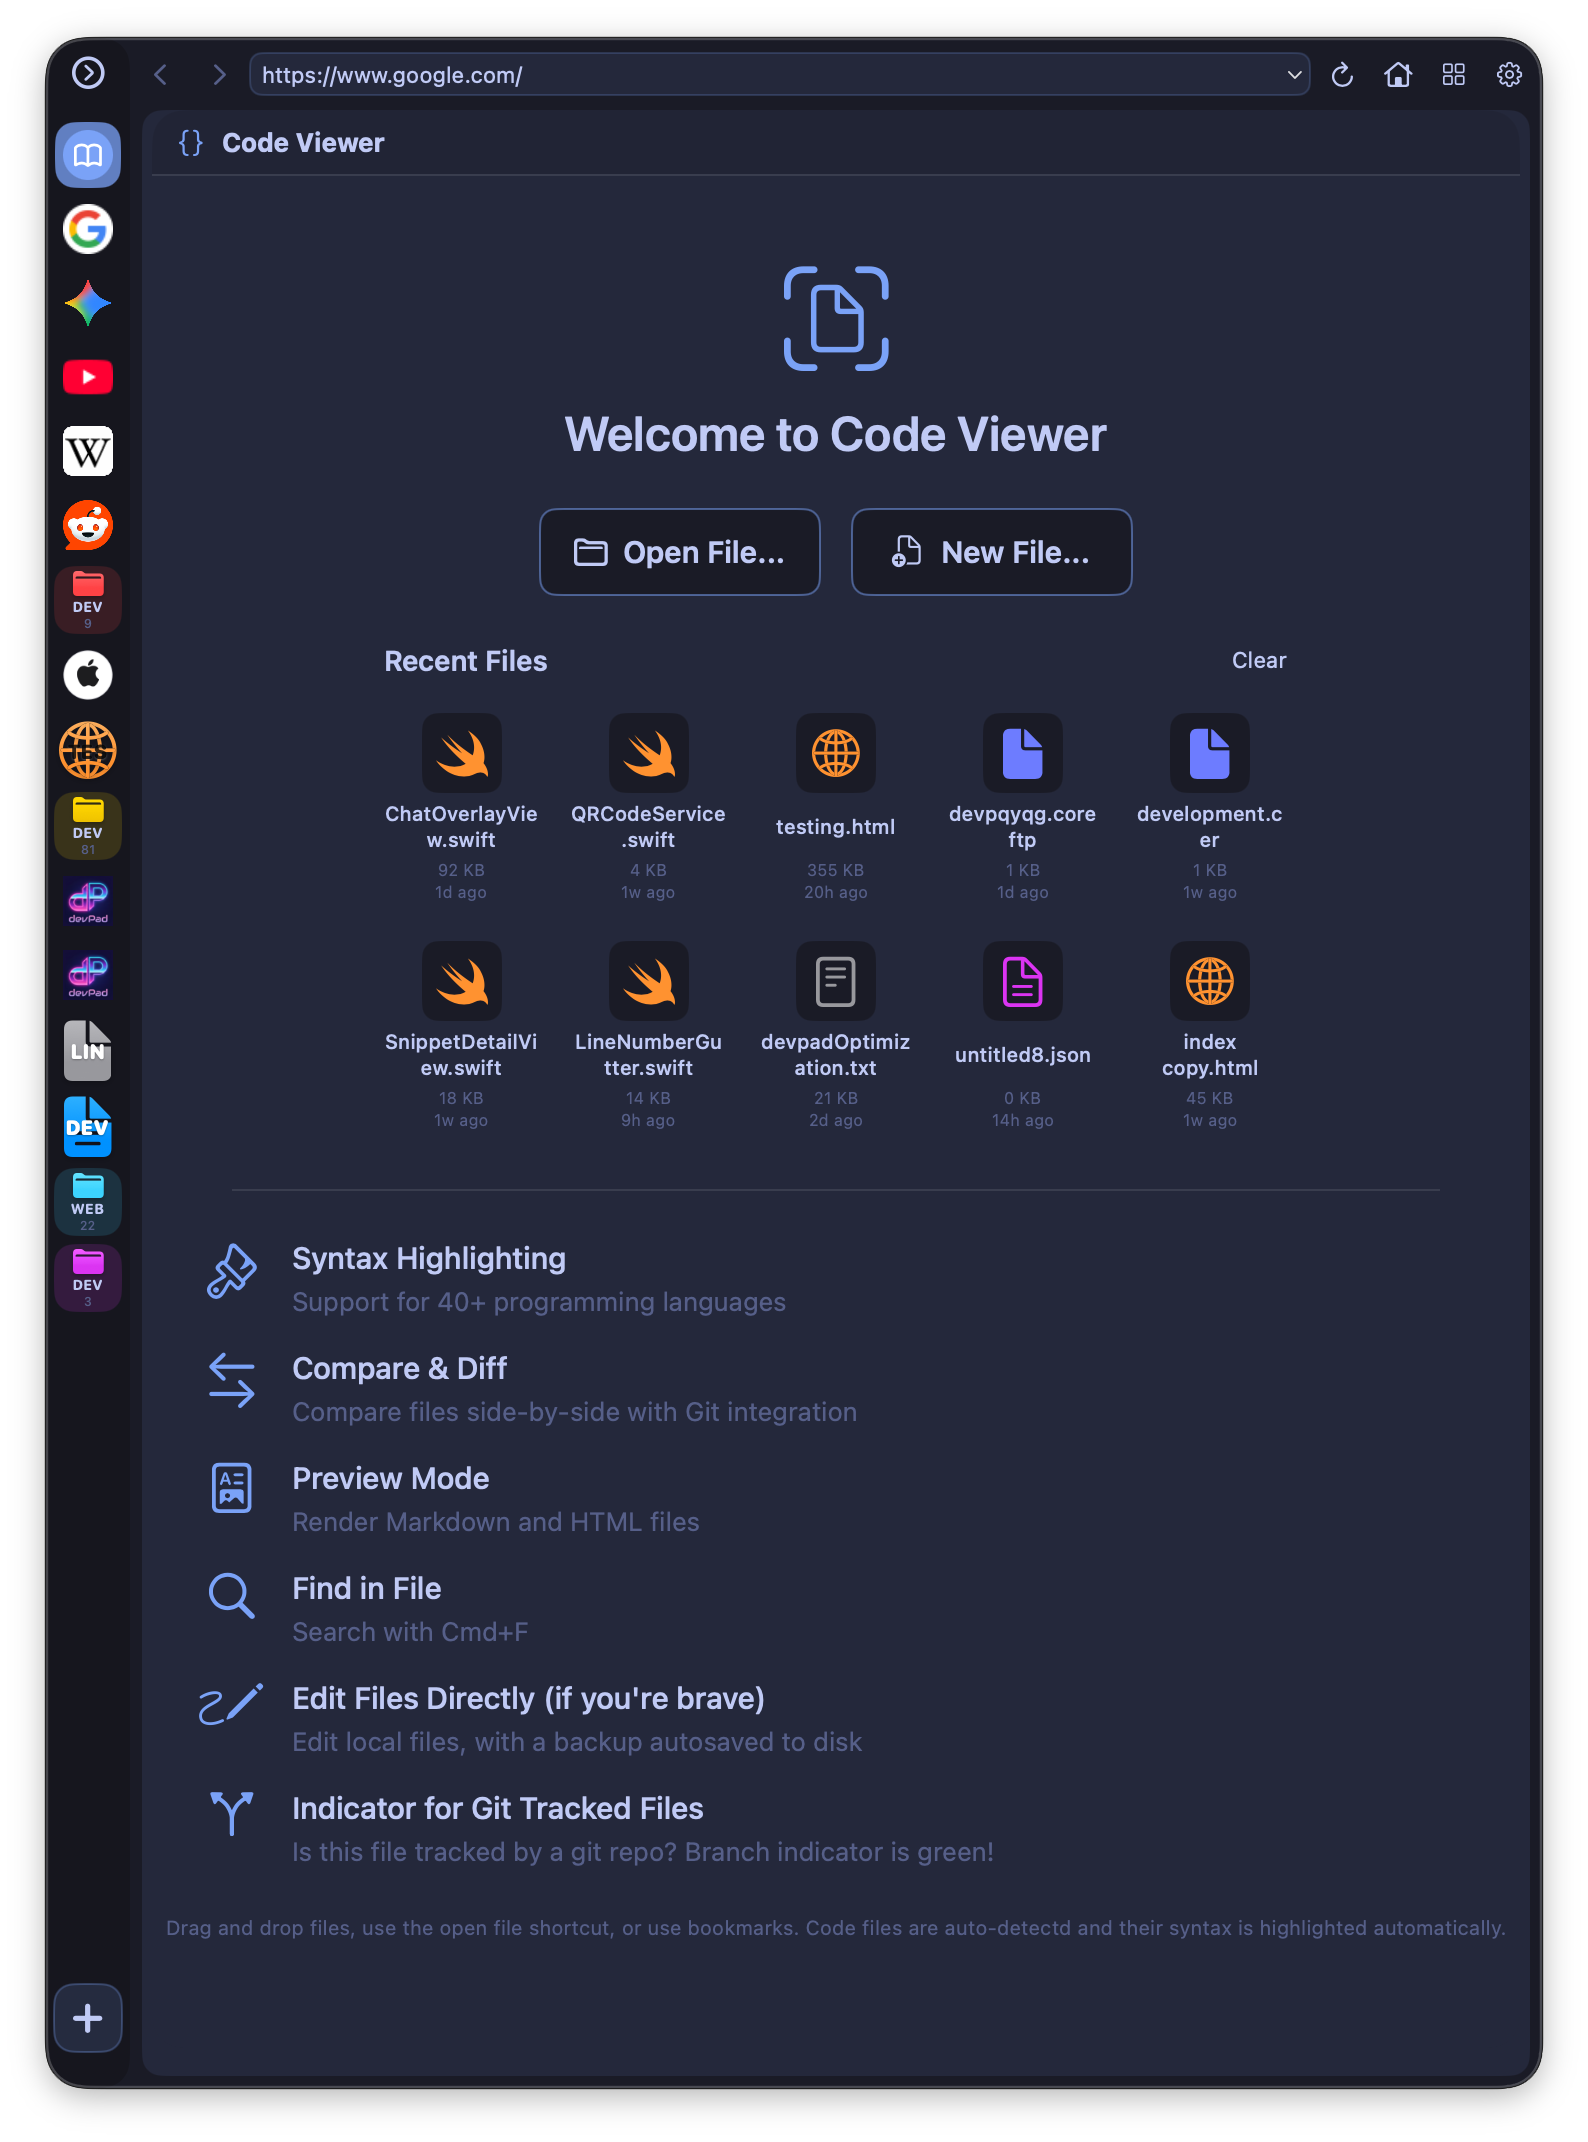
Code Viewer
View, edit, and compare code files with full syntax highlighting. Perfect for quick edits, reviewing code, or comparing versions.
Opening Files
There are several ways to open code files:
- Drag and drop from Finder into devPad
- Click "Open File" in the Code Viewer welcome screen
- Use Quick File (gear menu) if you've set up a quick-access folder
- Click a recent file from the welcome screen's file history
- Bookmark code files in the browser for instant access
Syntax Highlighting
devPad automatically detects the language from the file extension and applies appropriate highlighting. Supported languages include Swift, Python, JavaScript, TypeScript, Go, Rust, C/C++, Java, Ruby, PHP, SQL, HTML, CSS, JSON, YAML, Markdown, and 30+ more.
How to: Override Language Detection
If devPad detects the wrong language (e.g., a config file without an extension):
- Click the language label in the toolbar (e.g., "Plain Text")
- Select the correct language from the menu
- Highlighting updates immediately
Edit Mode
Click the Edit button in the toolbar to enable editing. When you make changes:
- The Save button appears (also accessible via Cmd+S)
- A backup is automatically created before saving
- You'll see an unsaved changes indicator if you try to navigate away
Tip: Auto-pairs are enabled in edit mode - typing ( automatically inserts ), and similarly for brackets, quotes, and backticks.
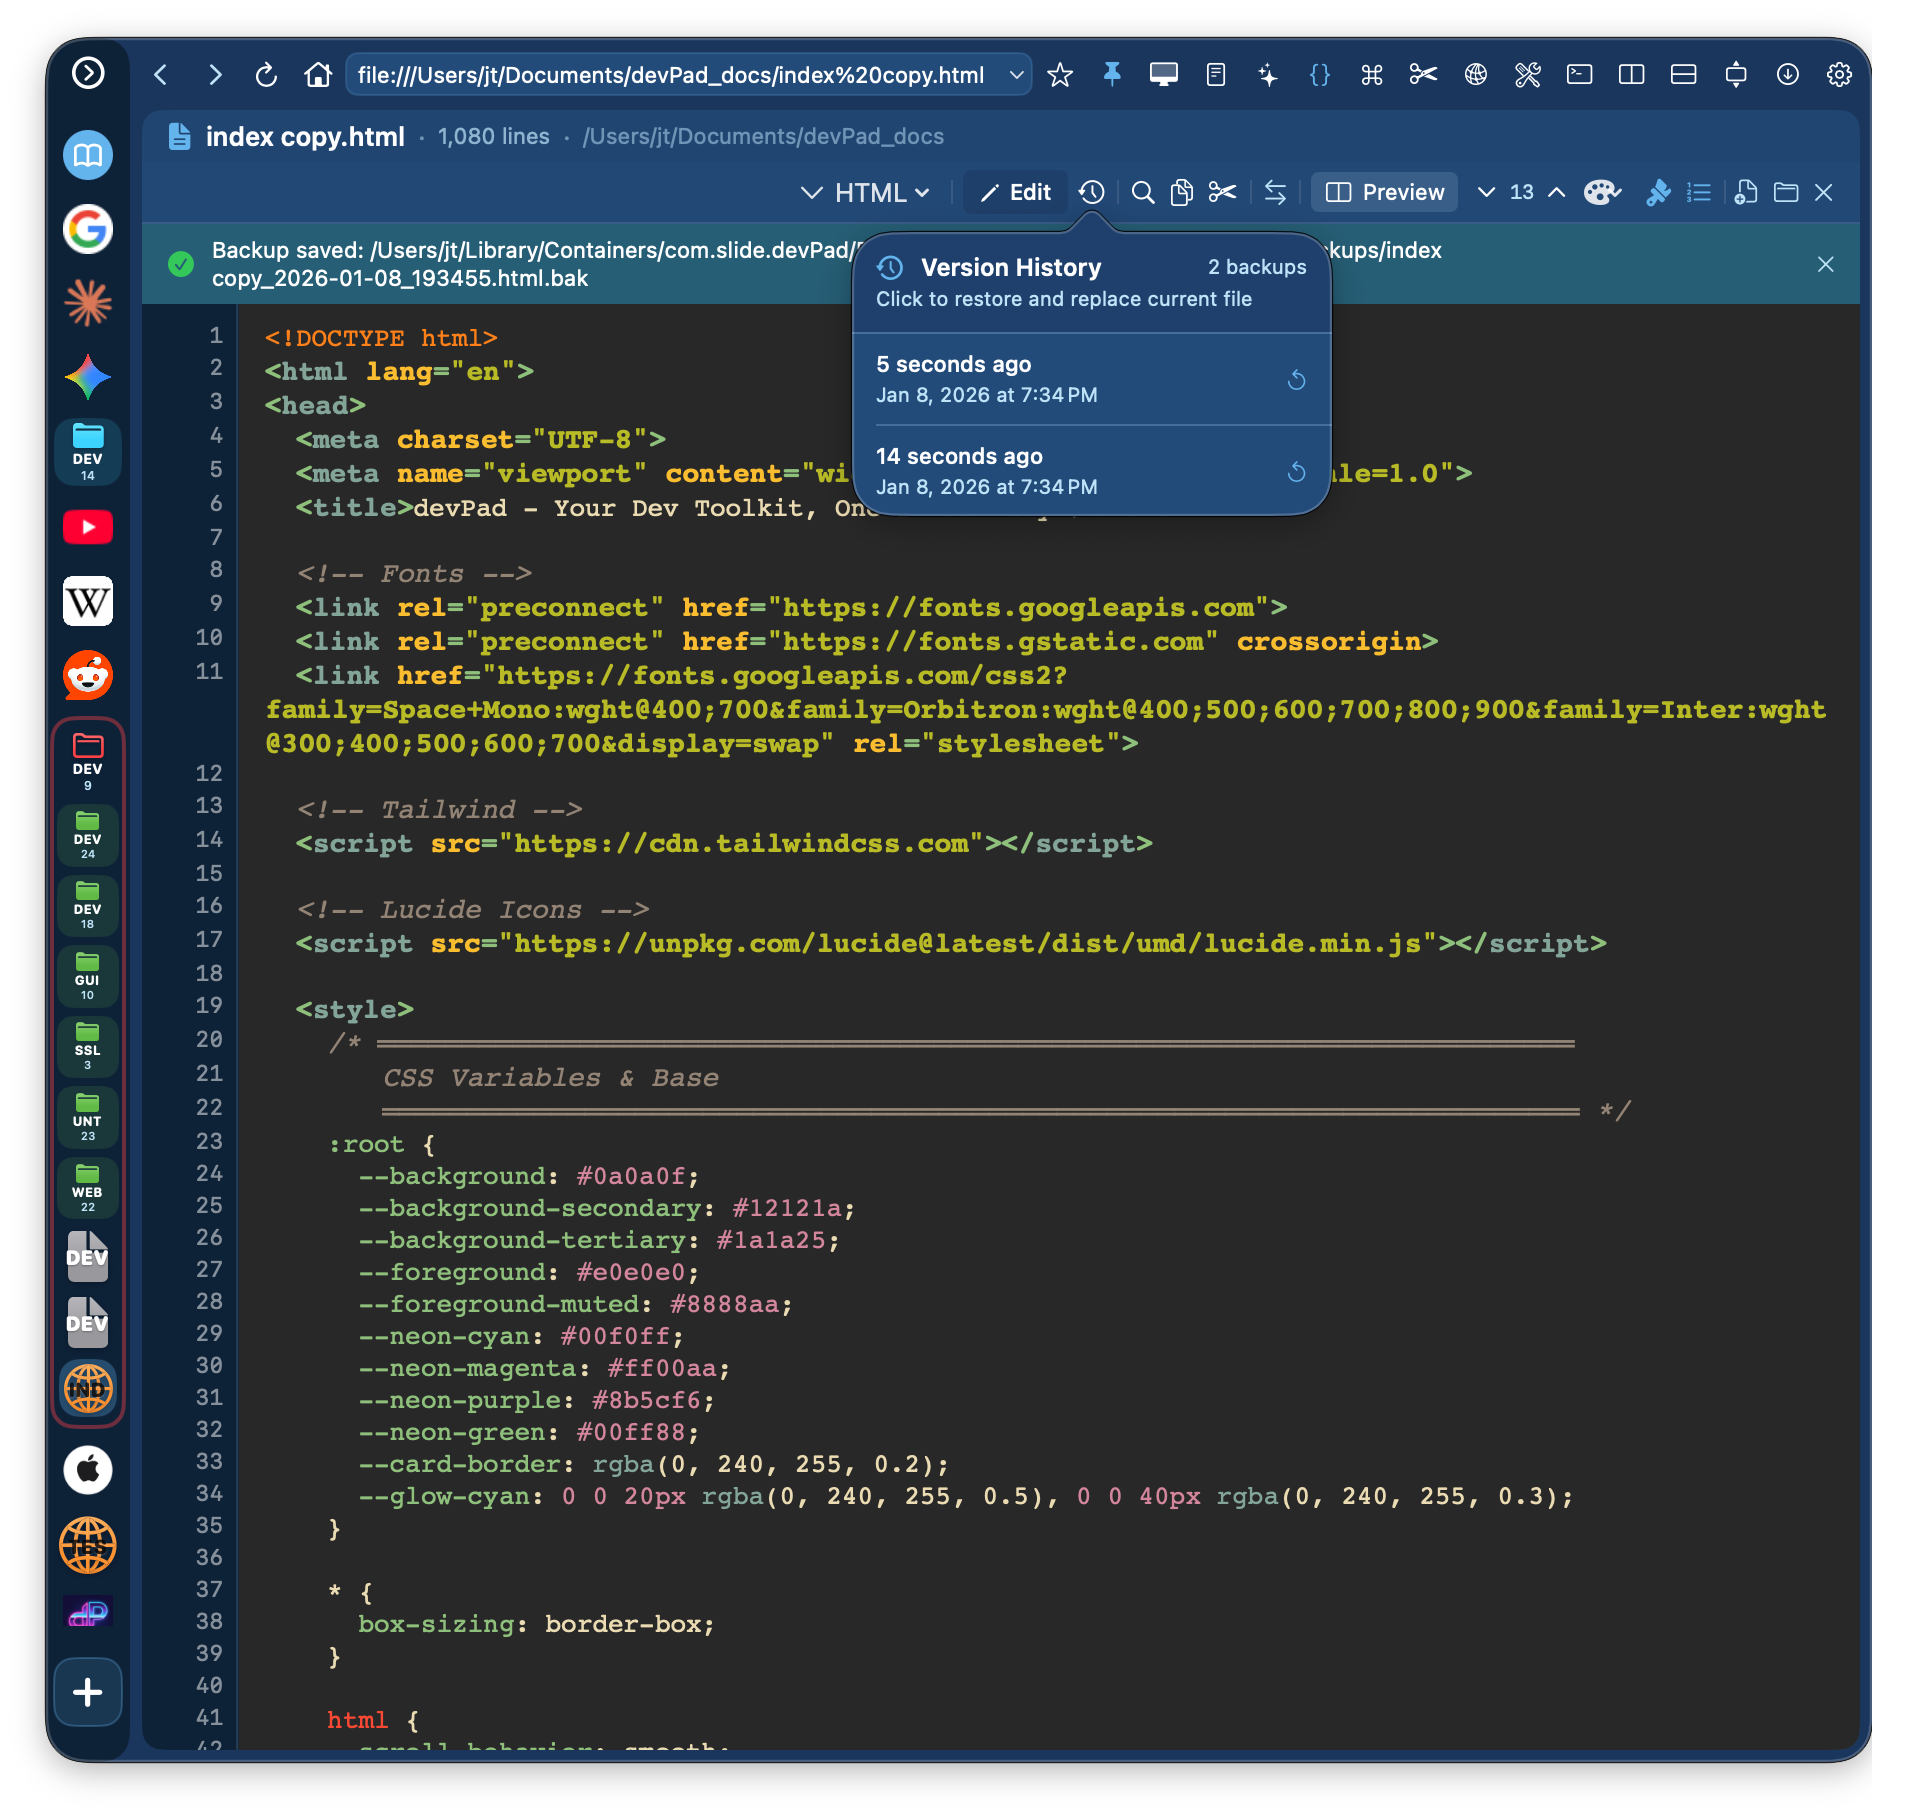
Version History
Every time you save a file, devPad automatically creates a backup. Click the clock icon in the toolbar to view version history:
- See all backups for the current file sorted by date
- Click any backup to restore it (replaces current file content)
- A safety backup is created before each restore
- Relative timestamps show "2 hours ago", "Yesterday", etc.
Tip: Backups are stored in ~/Library/Application Support/devPad/Backups/ if you need to access them directly.
Line Numbers
Click the line numbers icon in the toolbar to toggle line numbers in the gutter. This is especially useful for code review and debugging.
Search in File
Press Cmd+F to search within the file:
- Matches are highlighted throughout the document
- Use arrow keys or Enter to jump between matches
- The current match shows line number and position
Special File Types
Markdown Files (.md)
Click "Preview" to see rendered Markdown with proper formatting, headings, links, code blocks, and lists. Toggle back to "Source" to edit.
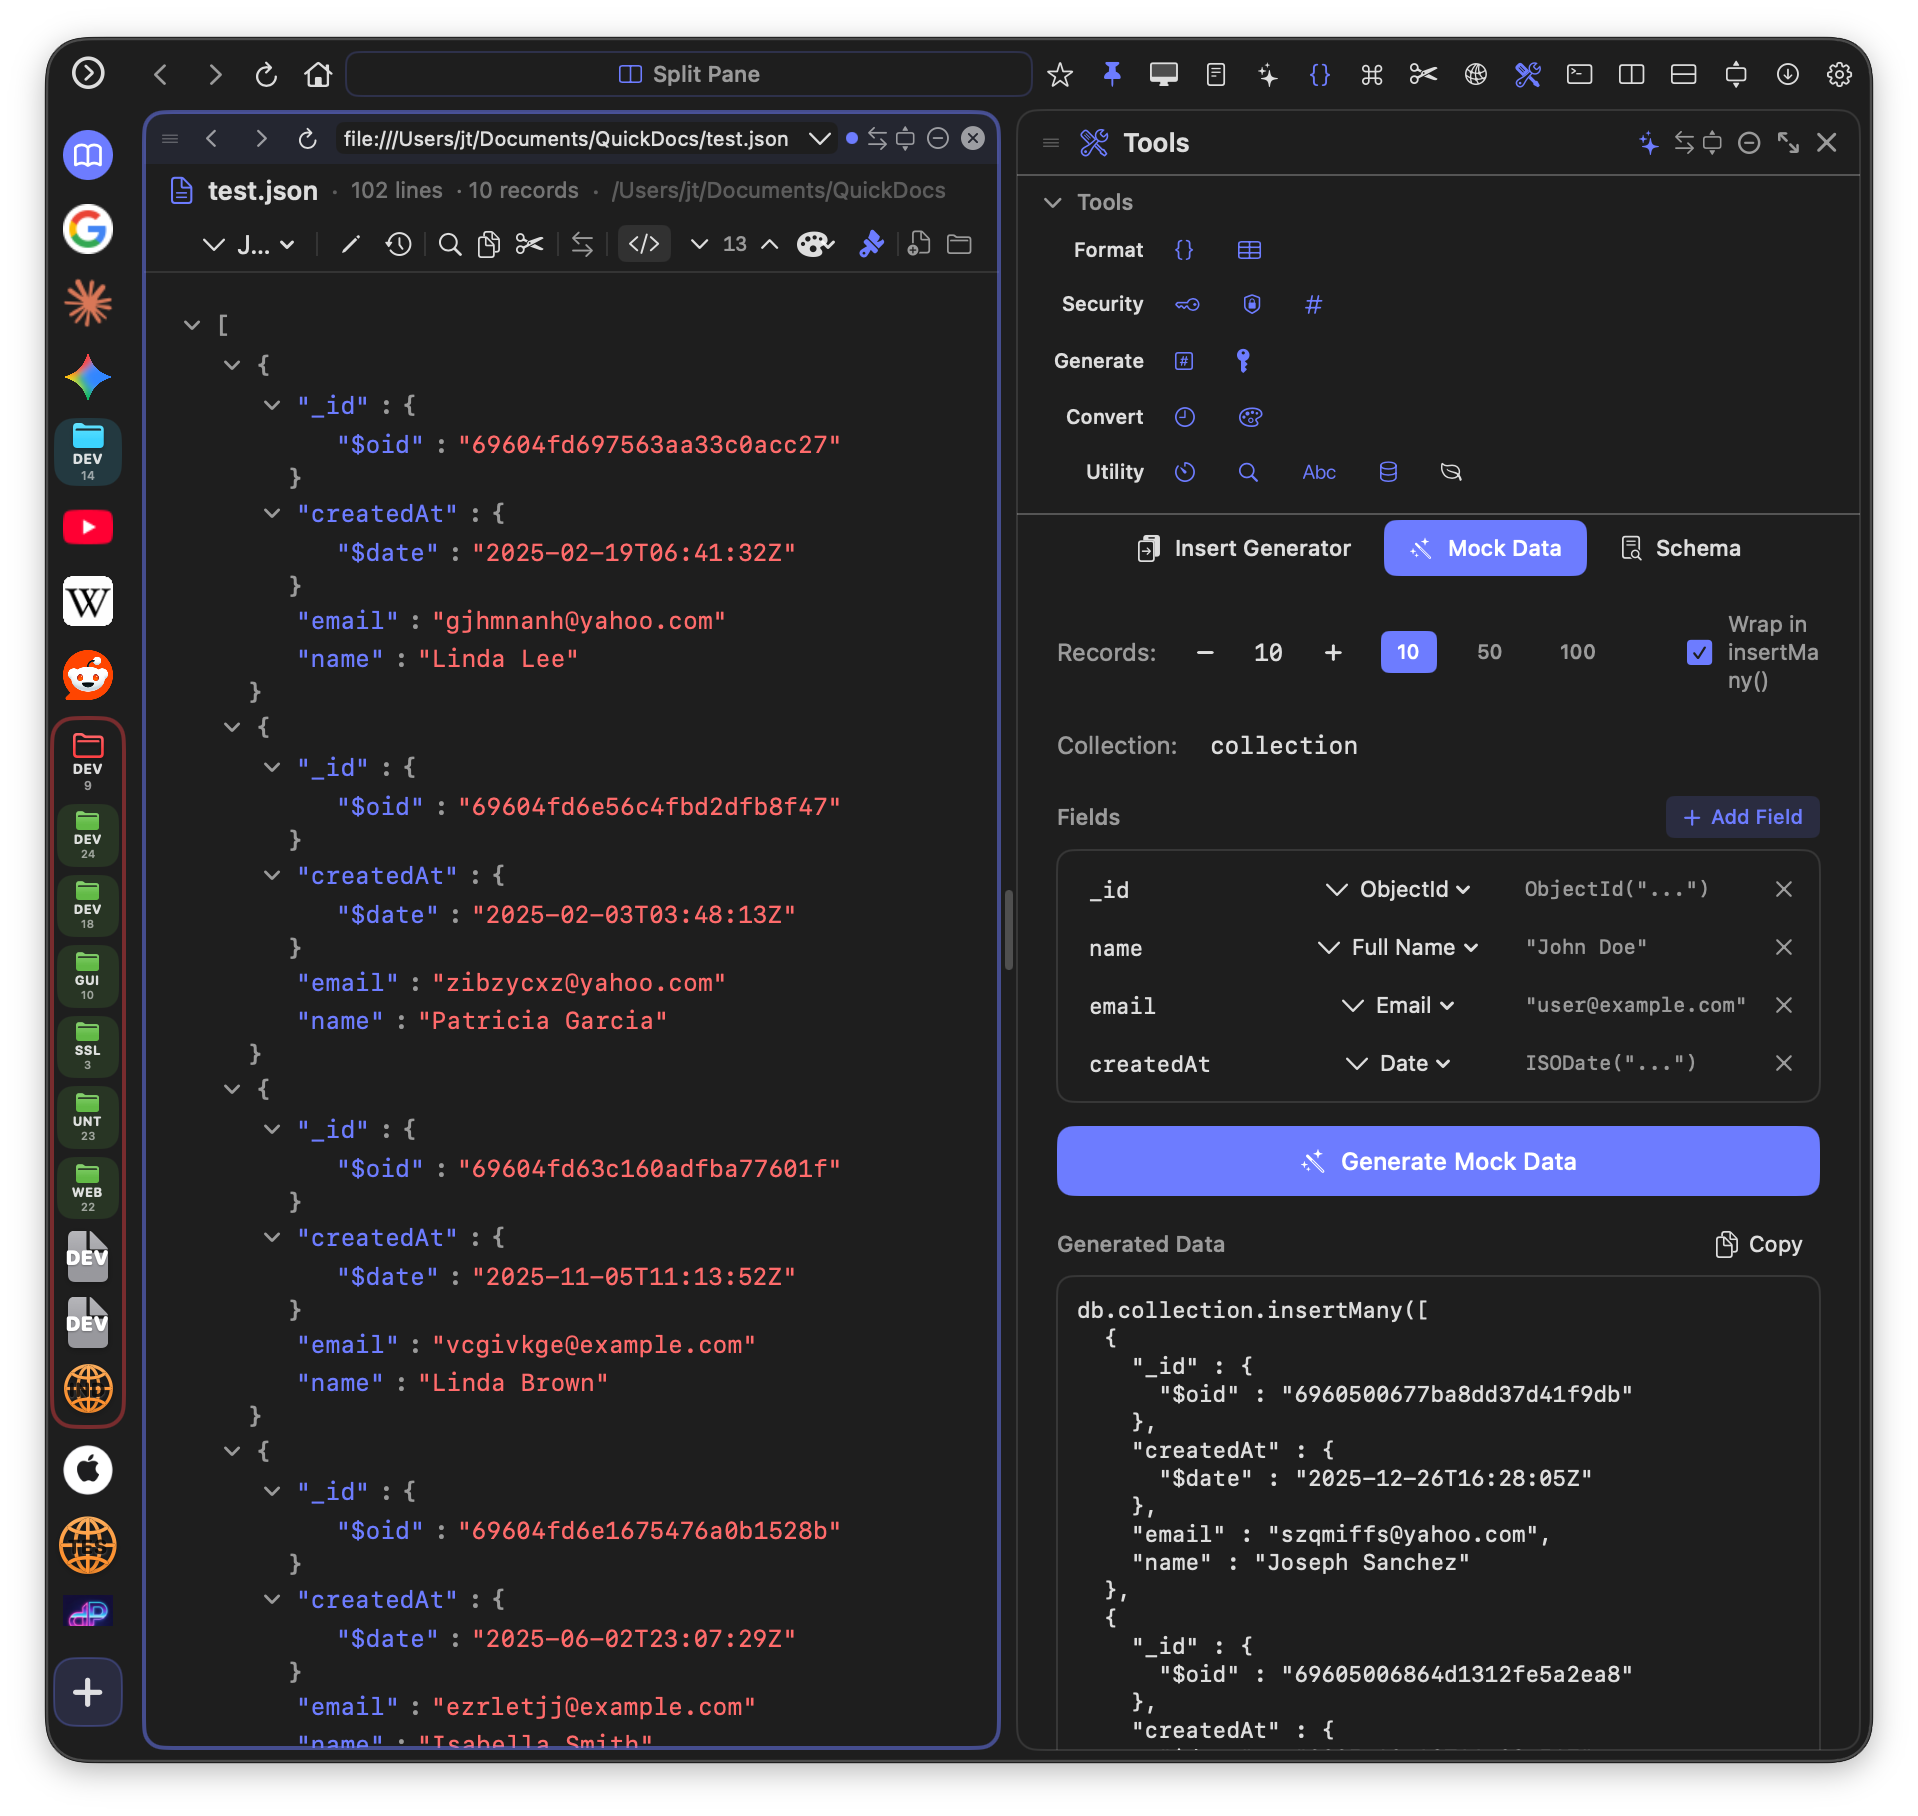
JSON Files
JSON files default to Tree View - an expandable, collapsible tree with color-coded values (strings, numbers, booleans, null). Click nodes to expand/collapse. The toolbar shows record count for arrays.
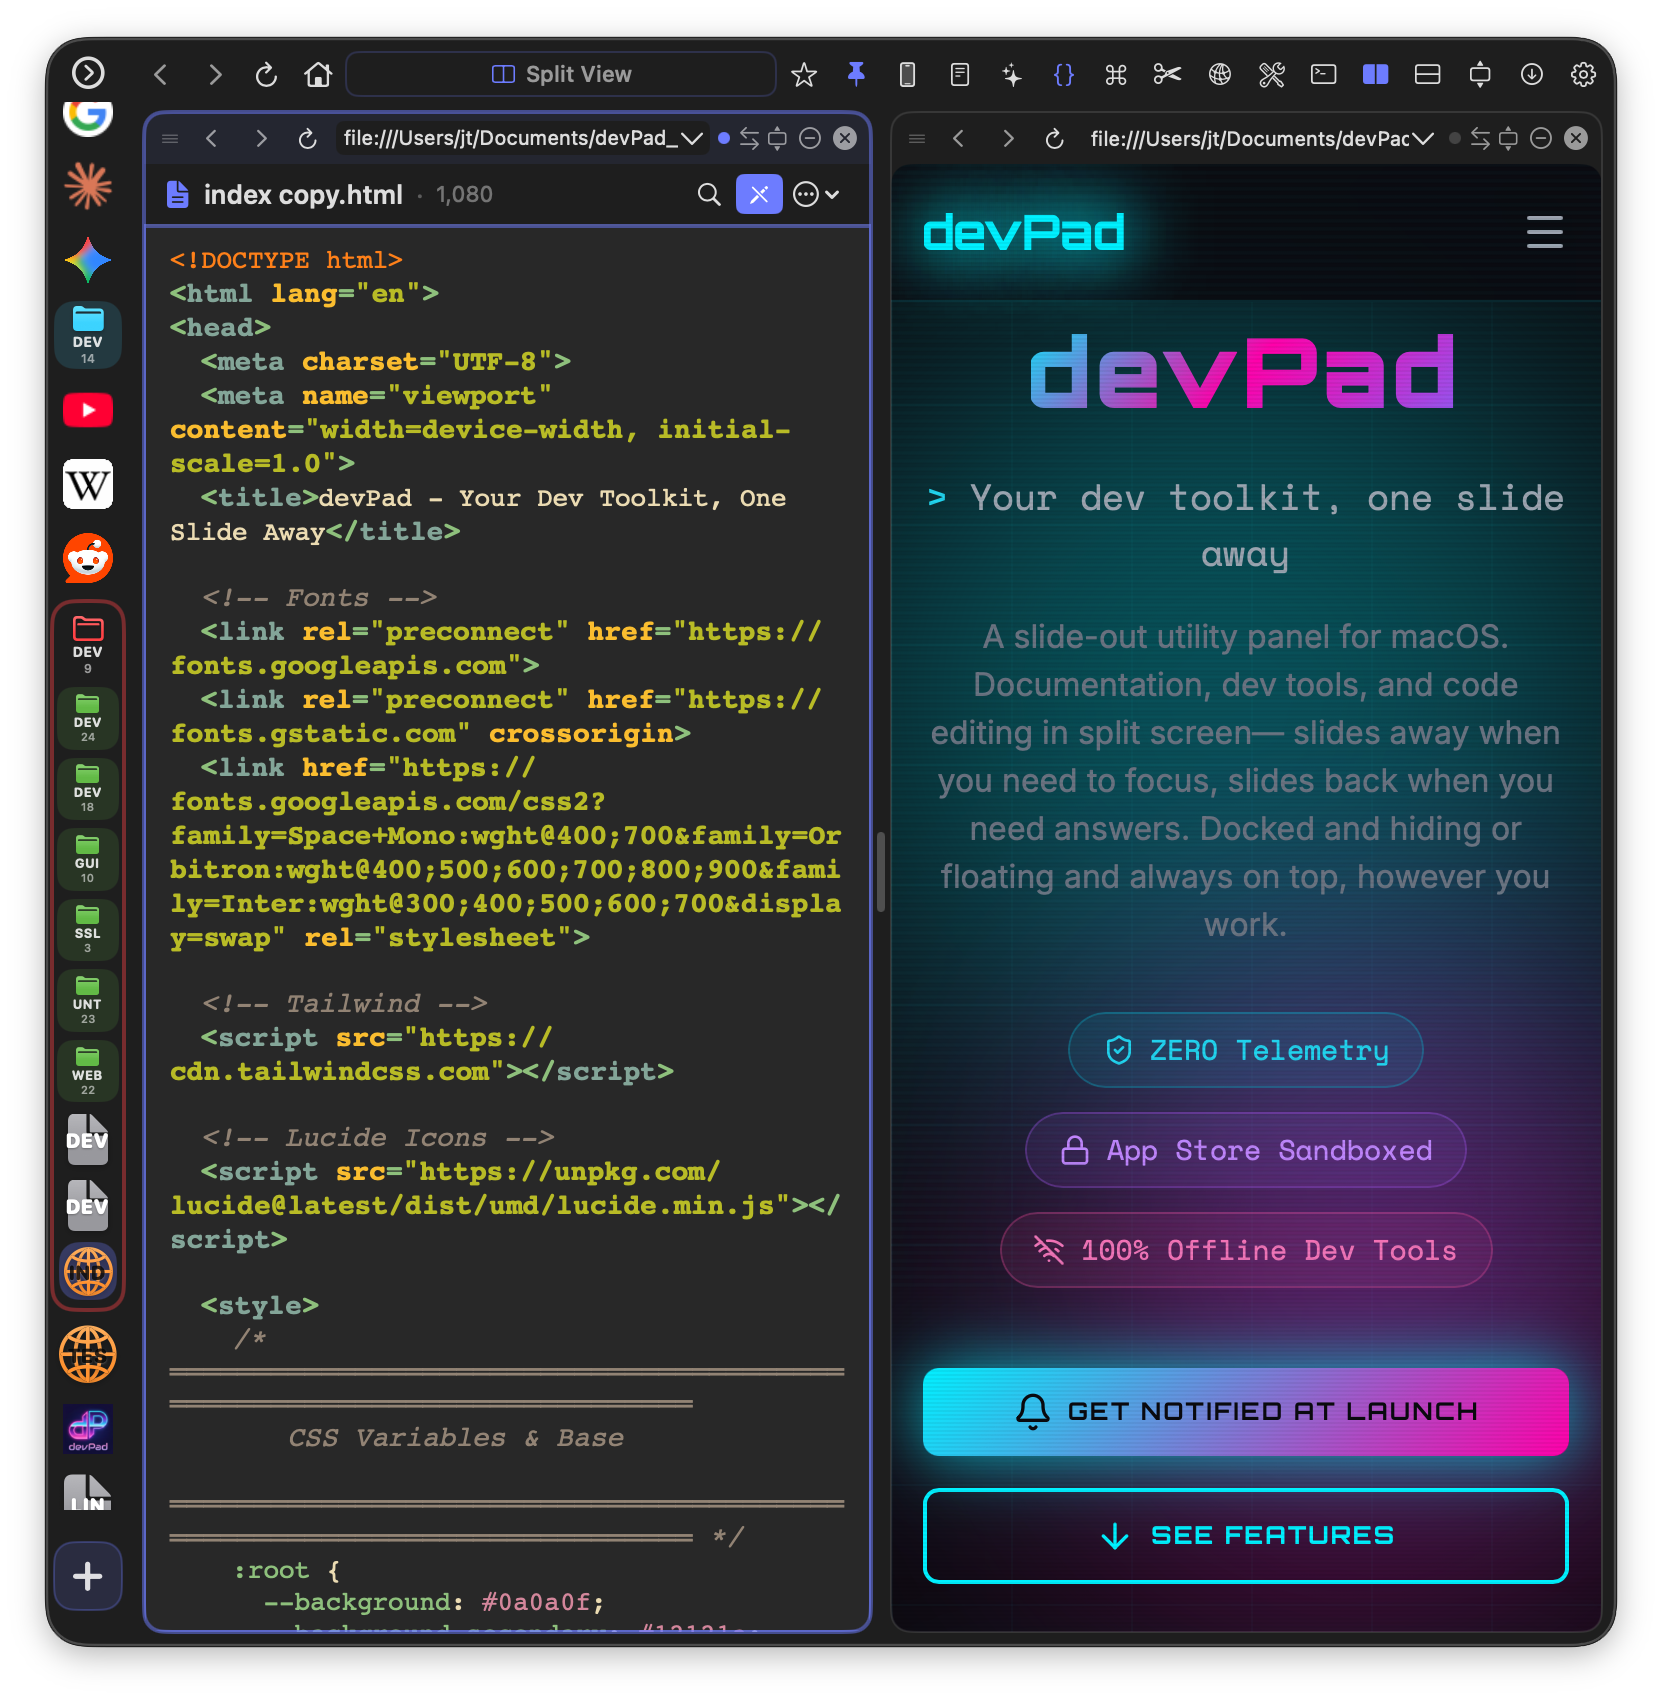
HTML Files
Click "Preview" to open a split view with the rendered HTML on one side and source code on the other. The "Reload" button refreshes the preview after edits.
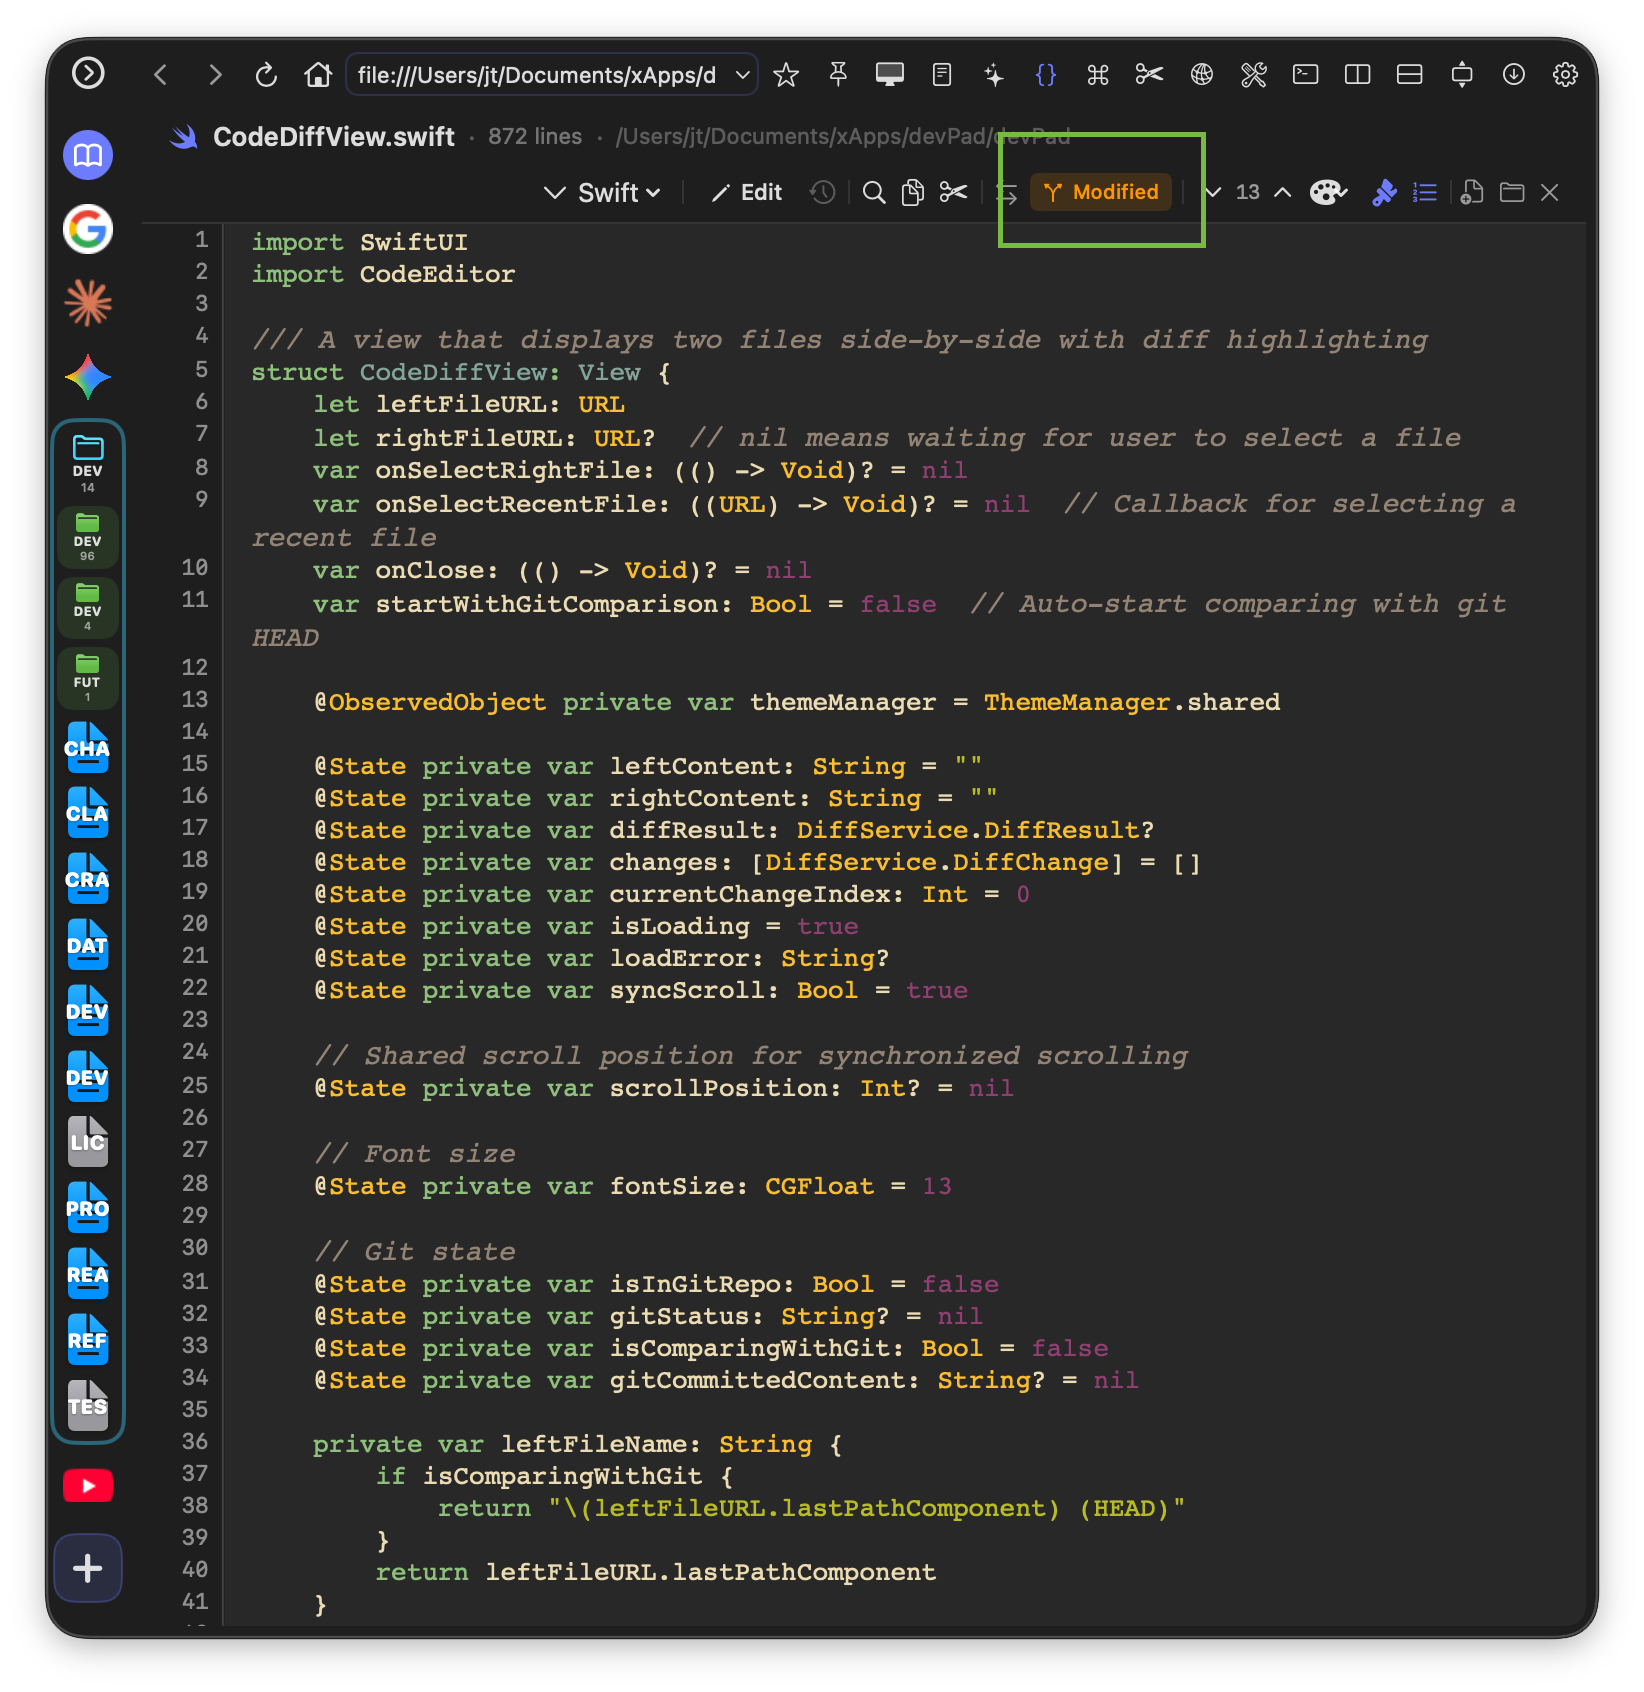
Git Integration
If the file is in a git repository, devPad shows the git status in the toolbar:
- Green checkmark - File is committed and unchanged
- Yellow "Modified" badge - File has uncommitted changes
- Click the git badge to compare with HEAD (opens diff view)
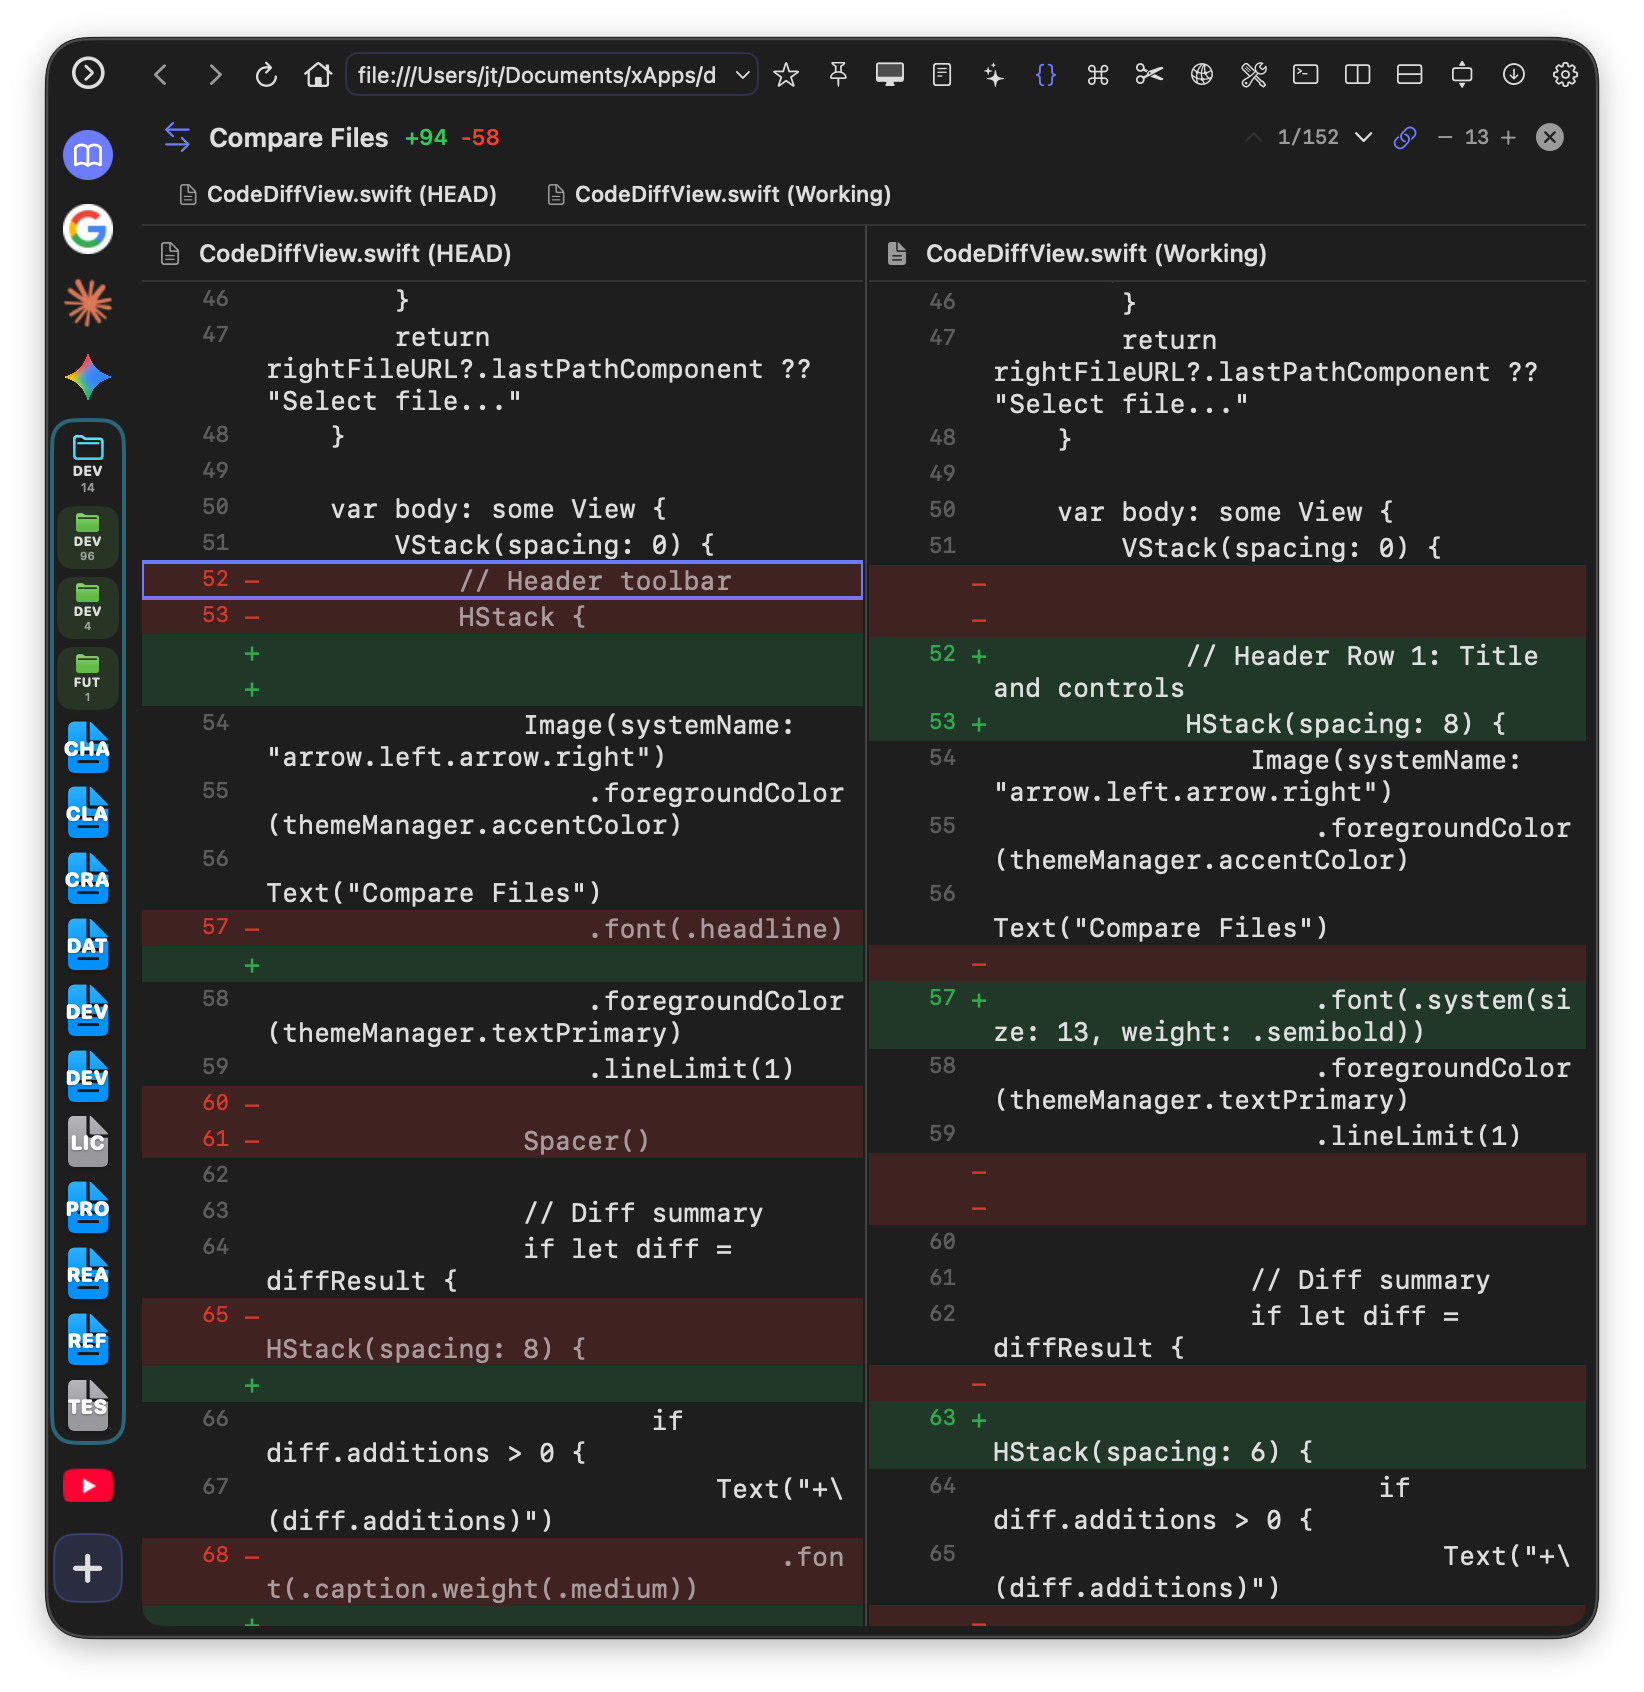
Git HEAD Compare Mode
When you click the git badge on a modified file, devPad opens a side-by-side diff view:
- Left side - The last committed version (HEAD)
- Right side - Your current working copy with changes
- Red highlighting - Lines removed or changed
- Green highlighting - Lines added or modified
- Sync scroll - Both sides scroll together (toggle in toolbar)
- Jump arrows - Navigate between changes with ↑/↓ buttons
How to: Review Your Changes Before Committing
- Open a modified file in Code Viewer
- Click the yellow "Modified" badge in the toolbar
- Review your changes in the side-by-side diff view
- Use the jump arrows (↑/↓) to navigate between hunks
- Click "Close" or press Escape to return to normal editing
This workflow helps catch unintended changes before you commit!
How to: Compare Two Files
- Open the first file in Code Viewer
- Click the "Compare" button in the toolbar
- Select the second file to compare against
- The diff view shows changes side-by-side with synchronized scrolling
Large Files
For performance, devPad automatically disables syntax highlighting for very large files (over 150KB or 3000 lines). You can manually enable it if needed, but expect slower performance. Files over 400KB always use plain text mode.
AI Chat
A built-in AI assistant that works with local LLMs (Ollama, LM Studio) or cloud APIs (OpenAI, Anthropic, etc.). Use it for code help, explanations, summarization, and more.
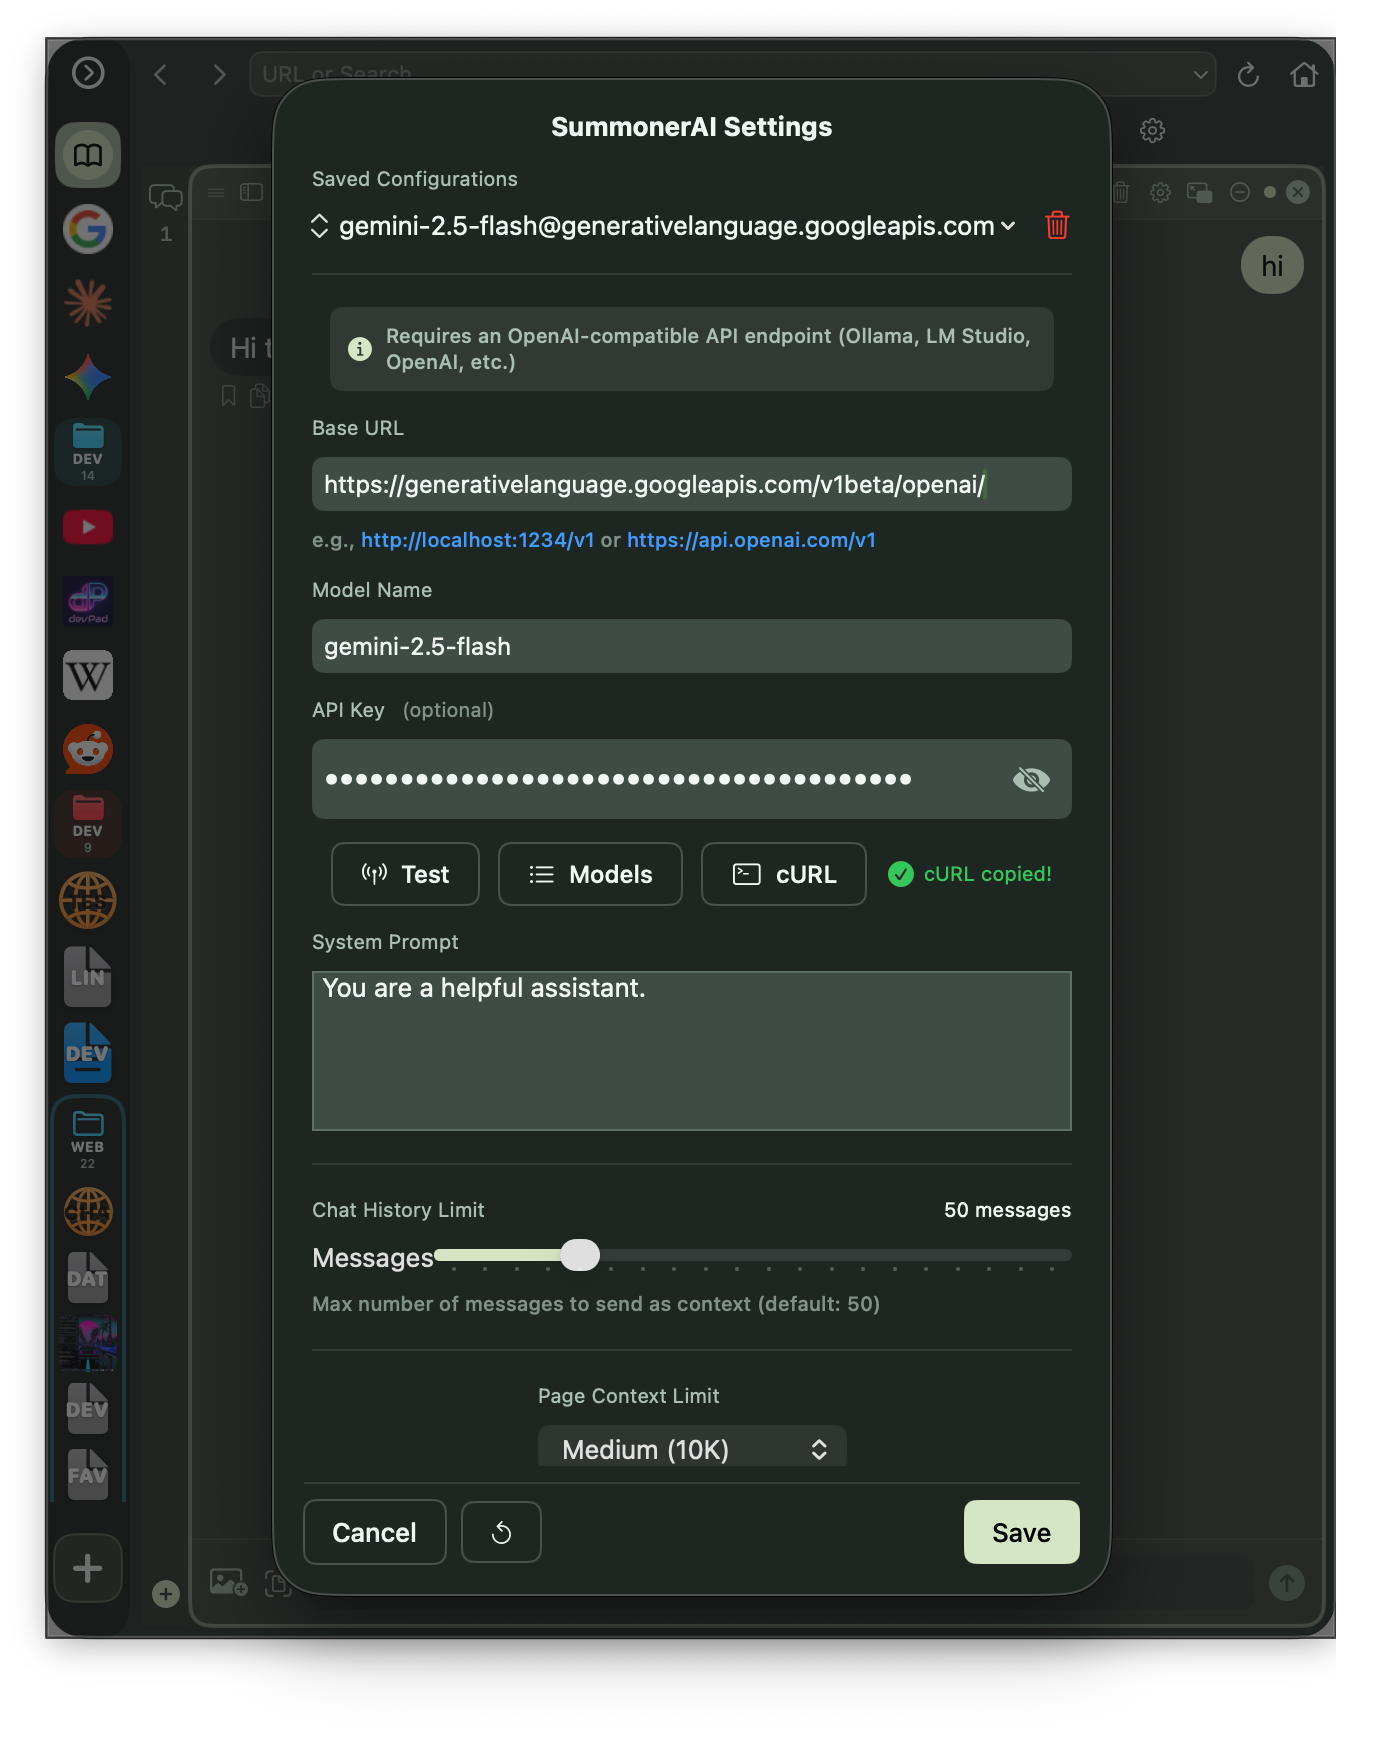
Setting Up AI
Before using AI Chat, you need to configure an endpoint:
- Open the gear menu and select "SummonerAI Settings"
- Enter your API endpoint URL (e.g.,
http://localhost:11434/v1for Ollama) - Add your API key if required (for cloud services)
- Select your model from the dropdown
- Click "Test Connection" to verify
How to: Use with Ollama (Local)
- Install Ollama from ollama.ai
- Pull a model:
ollama pull llama3.2 - In devPad, set endpoint to:
http://localhost:11434/v1 - Leave API key blank
- Select your model and start chatting
Opening AI Chat
Click the sparkle icon (✨) in the toolbar to open AI Chat. It can appear as:
- Split pane - Dock alongside browser or code viewer
- Full screen - Expand to fill the entire panel
- Pop-out window - Detach as a floating window
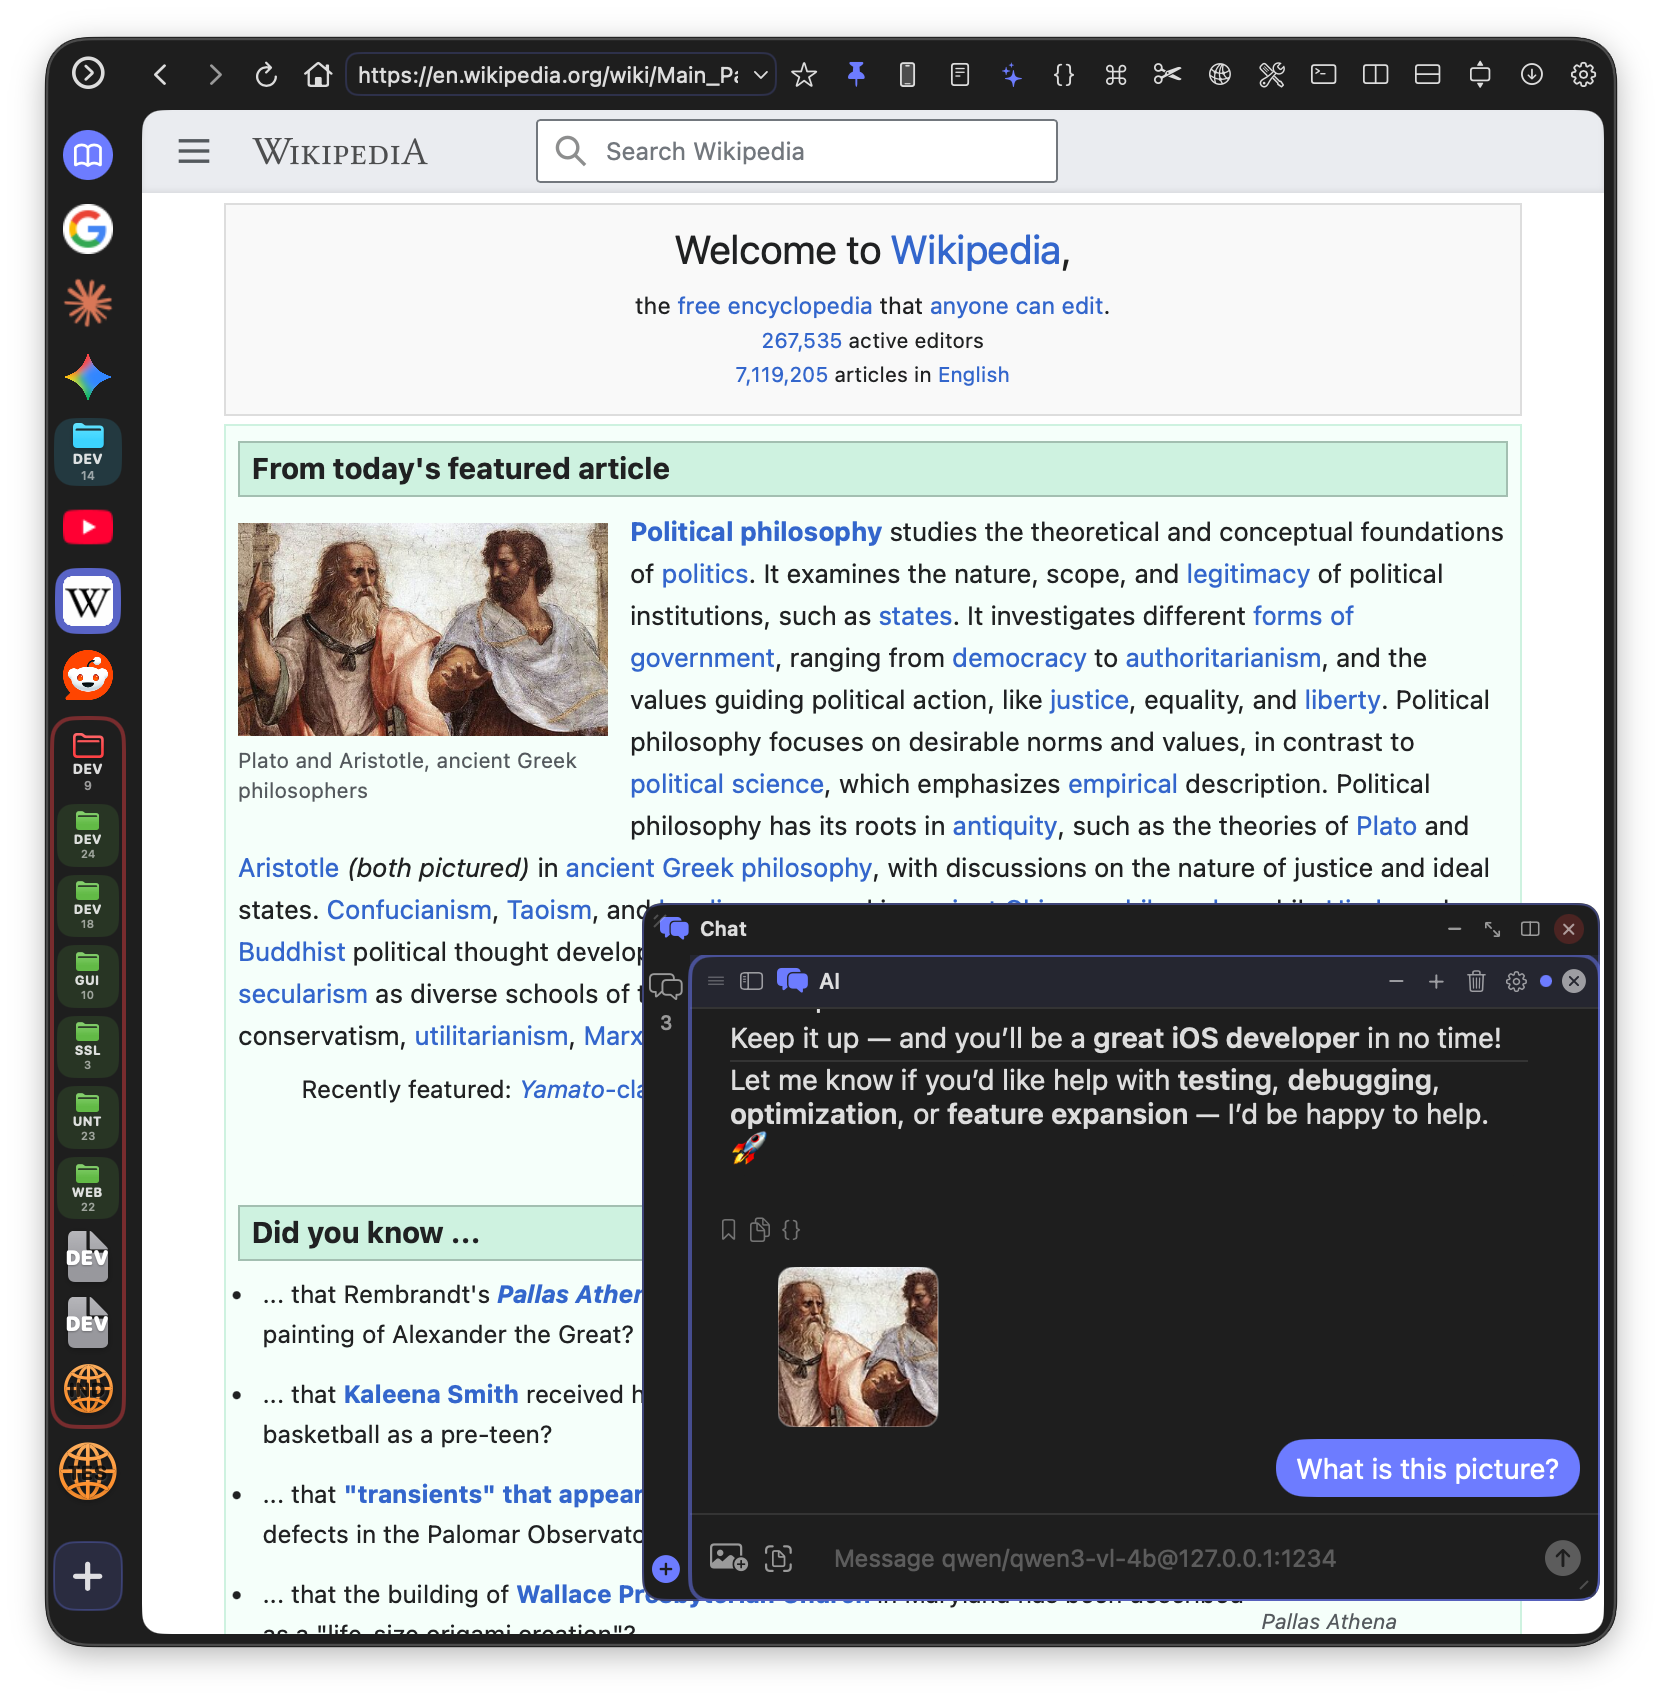
Page Context
The most powerful feature of AI Chat is sending page content for context:
- Navigate to a page in the browser
- Open AI Chat
- Click the "Add Context" button (📄 icon)
- The page content is extracted and attached to your message
- Ask questions like "Summarize this article" or "Explain this code"
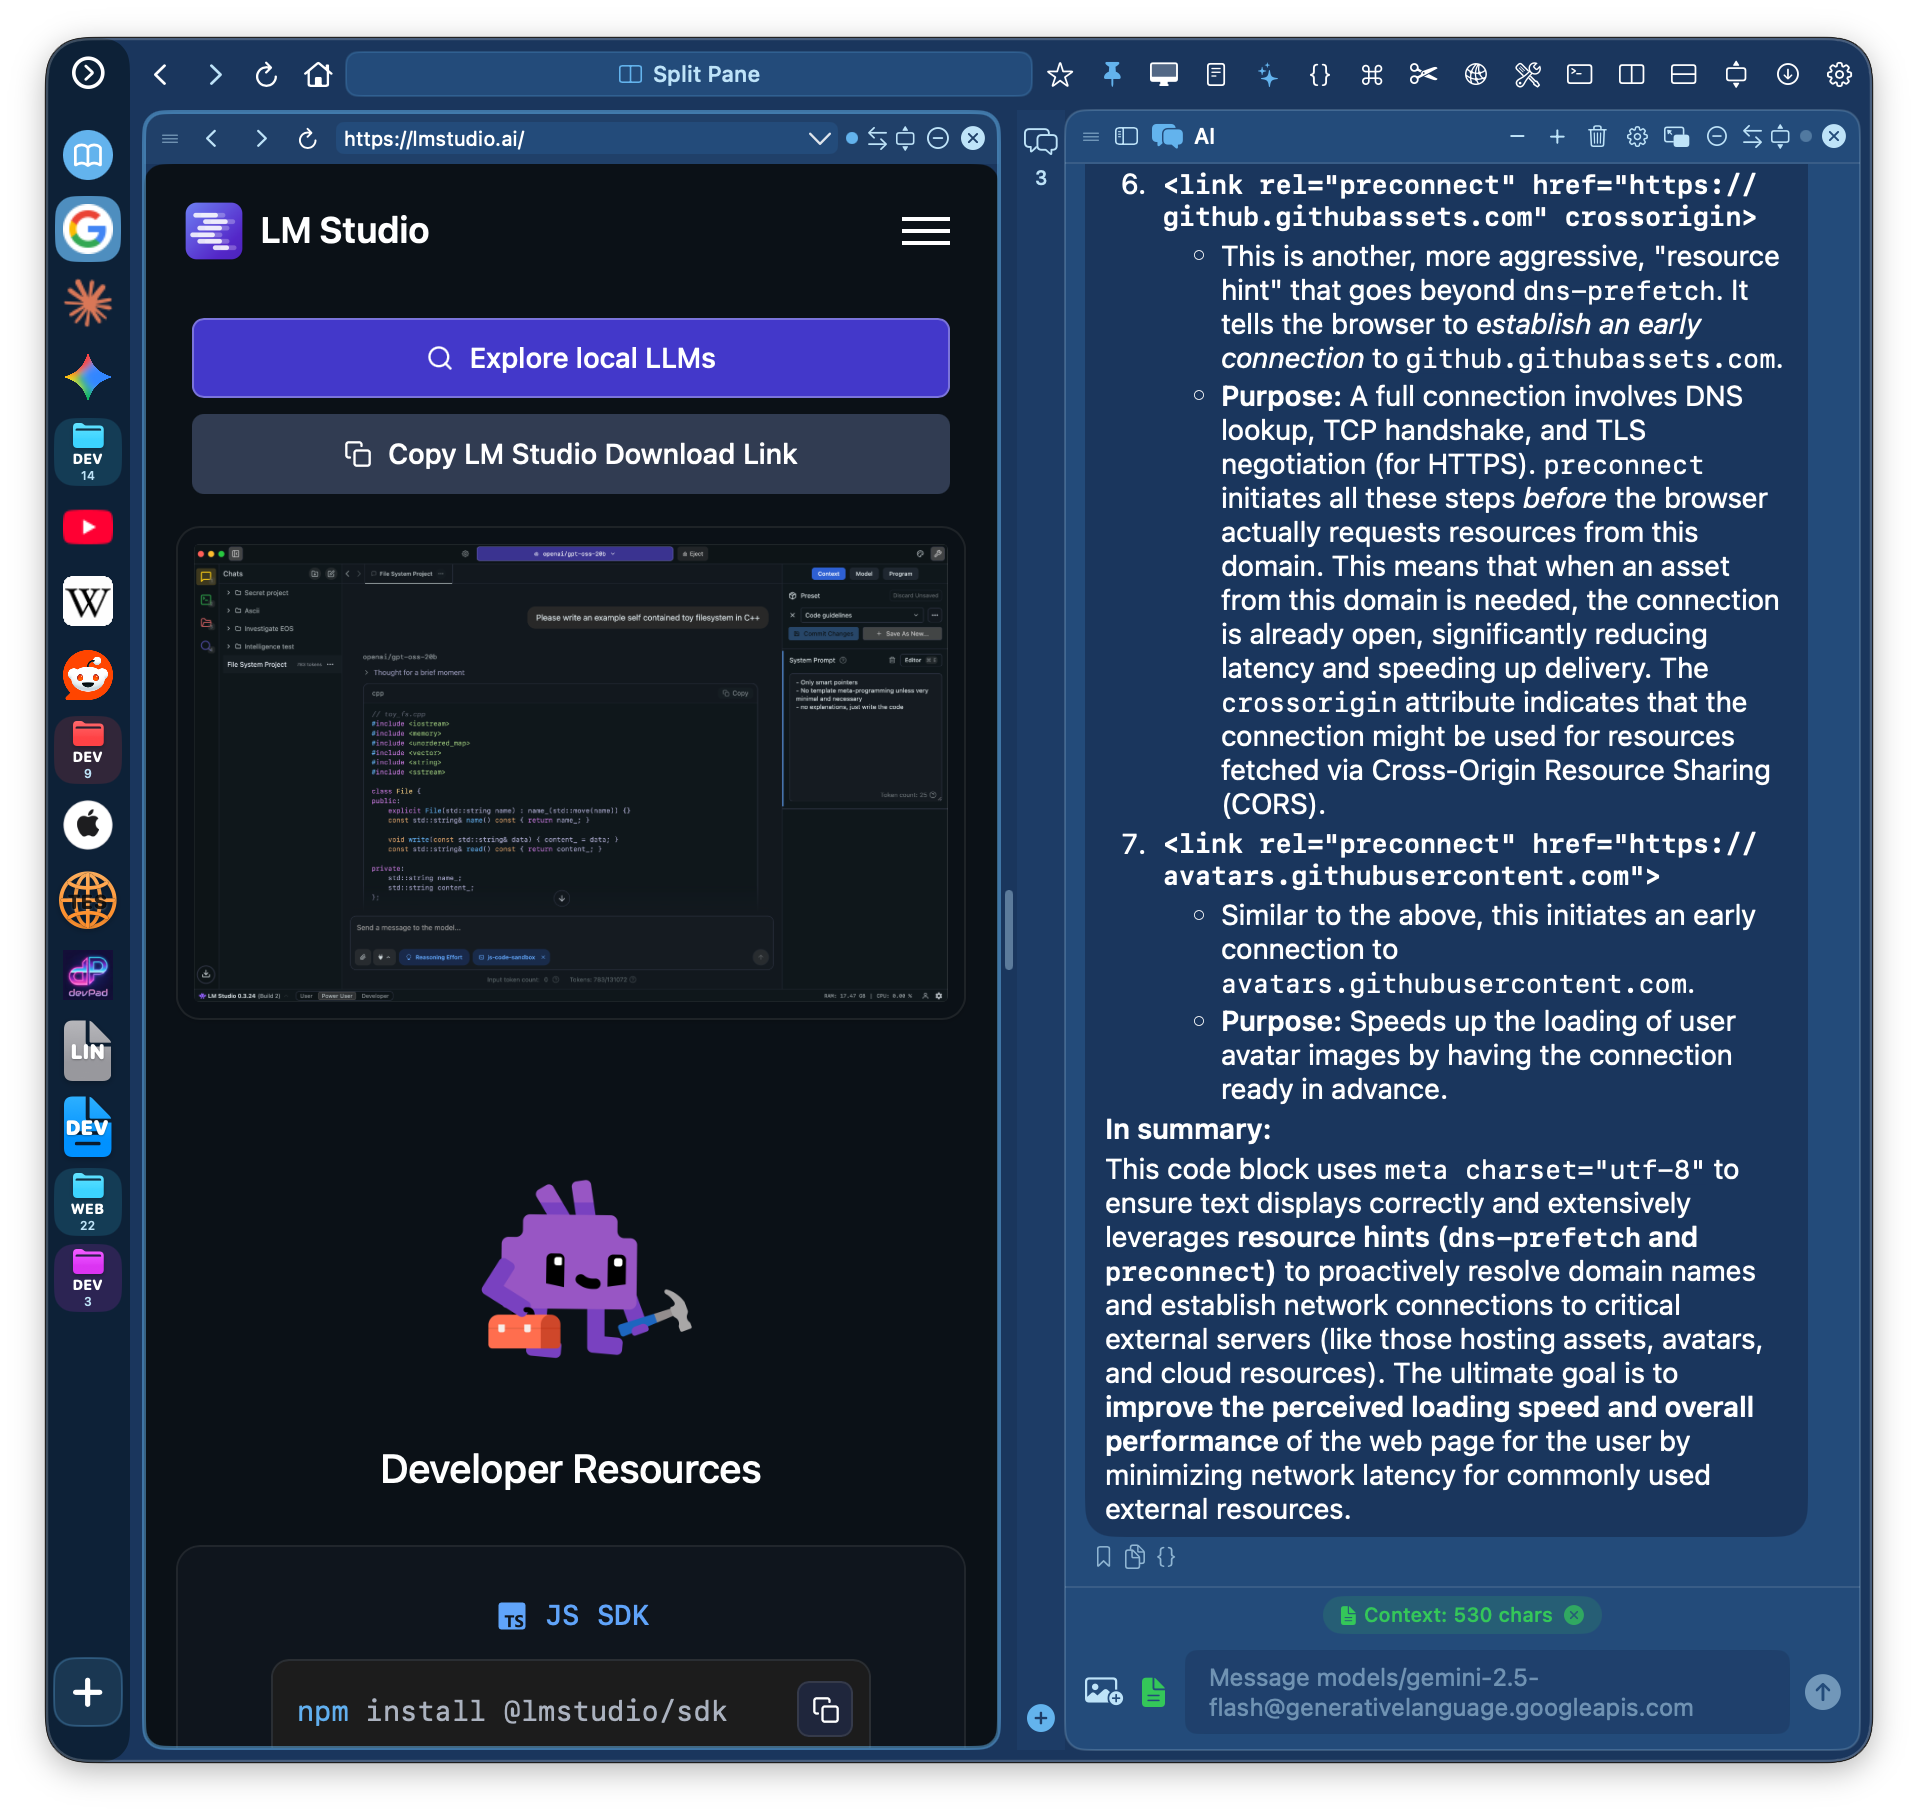
Tip: The sparkle button (✨) in the browser toolbar is a shortcut that opens AI Chat and automatically adds the current page as context with a "Summarize this" prompt.
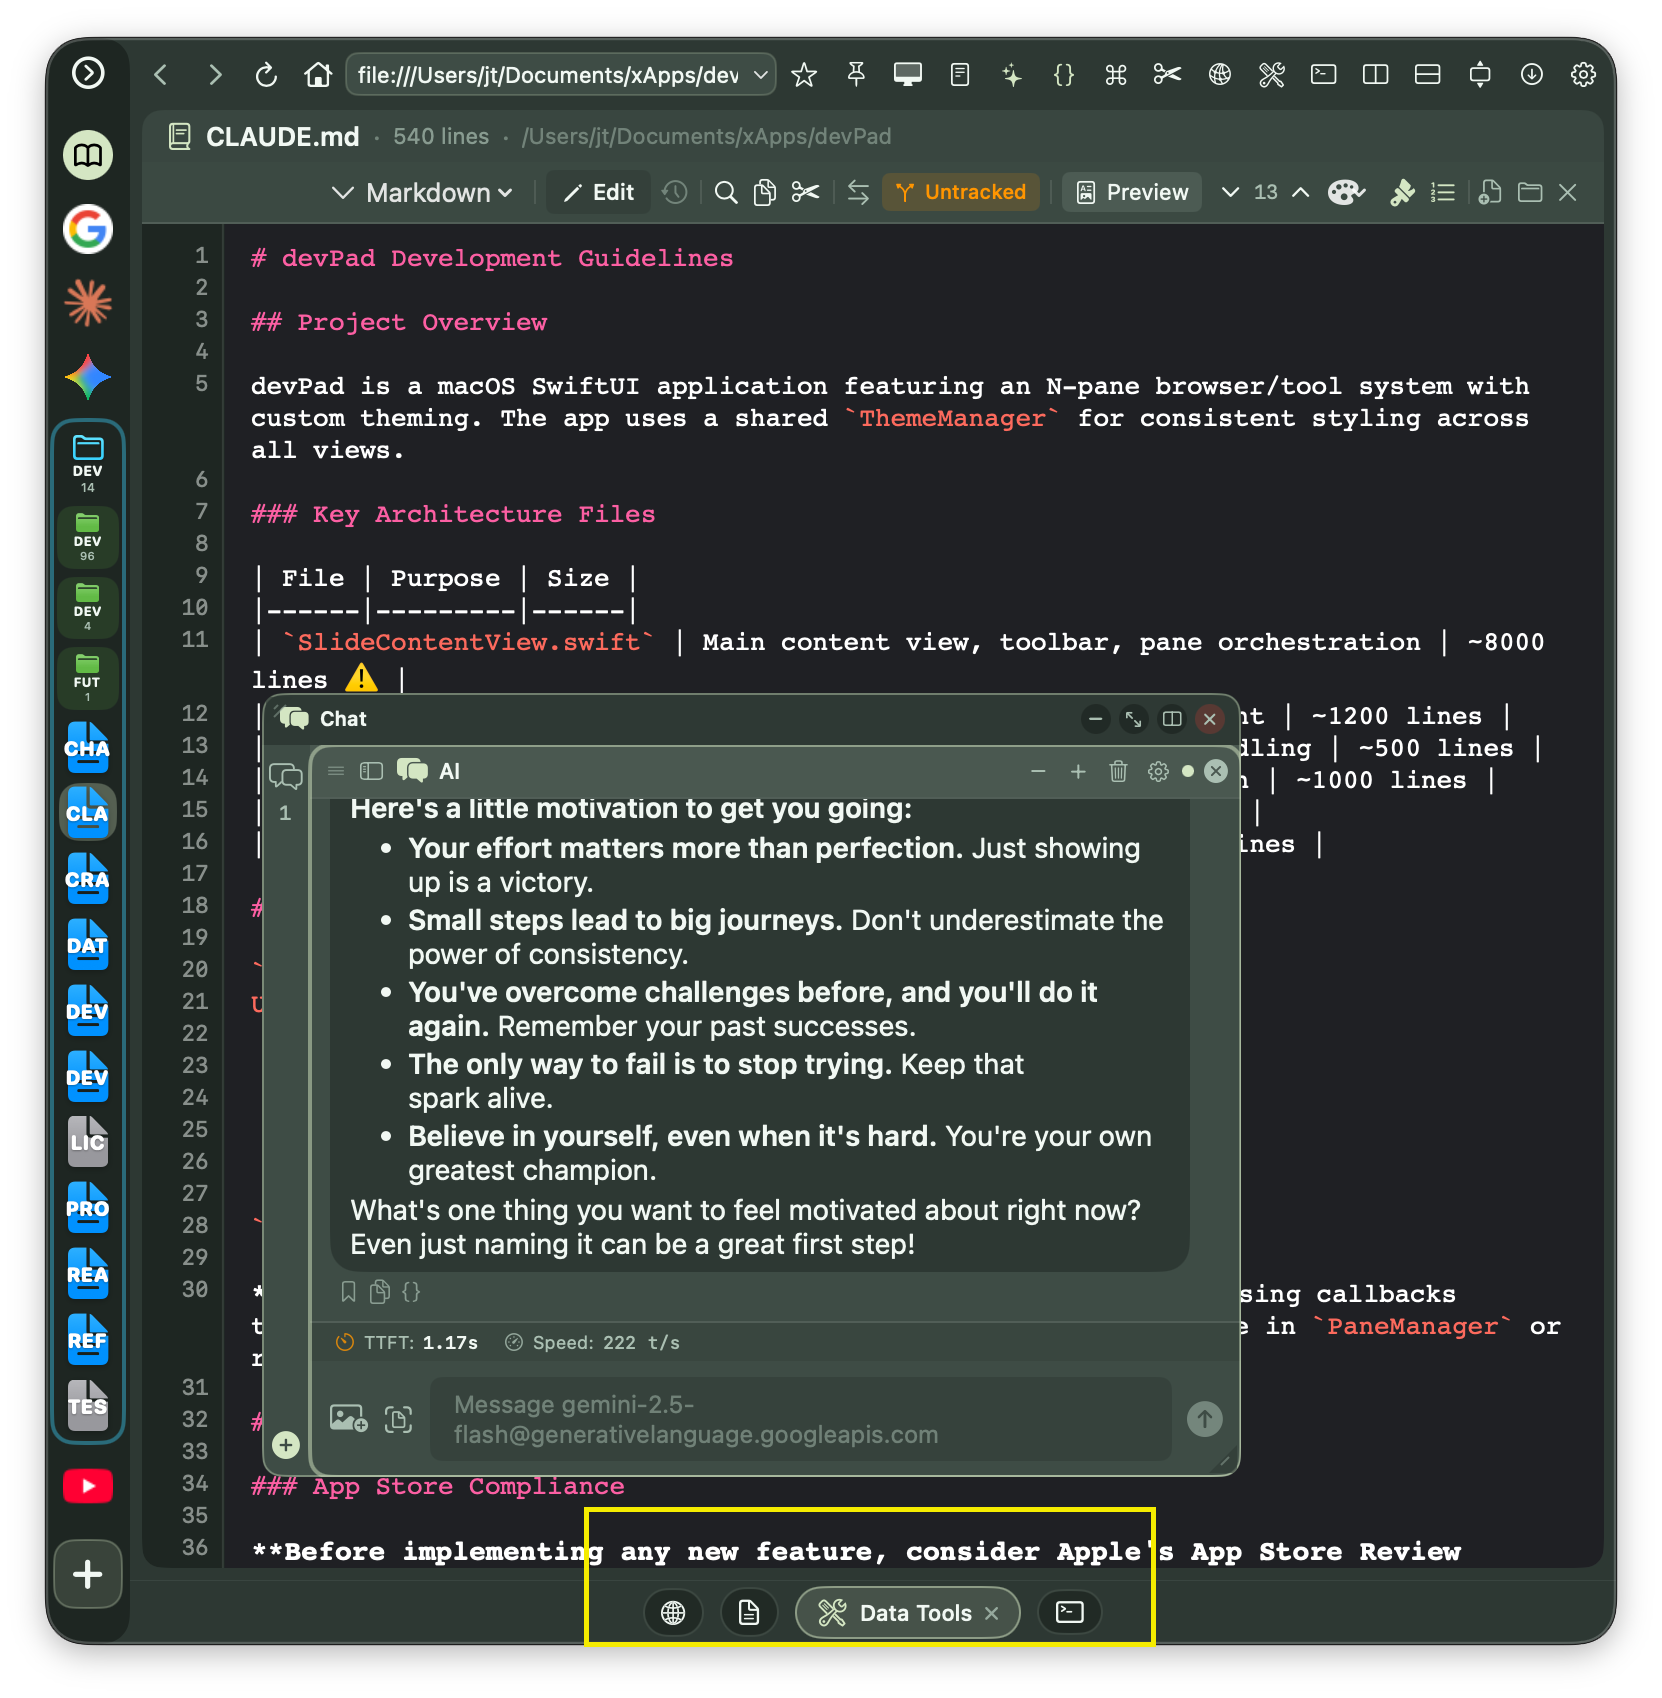
Ask AI from Tool Panes
Each tool pane (Snippets, Console, Relay, Data Tools) has a sparkles button (✨) that opens AI Chat with relevant context pre-loaded:
- From Snippets - Sends the current snippet content and notes
- From Console - Sends console logs or network request details
- From Relay - Sends HTTP request/response data
- From Data Tools - Sends the current tool's input/output
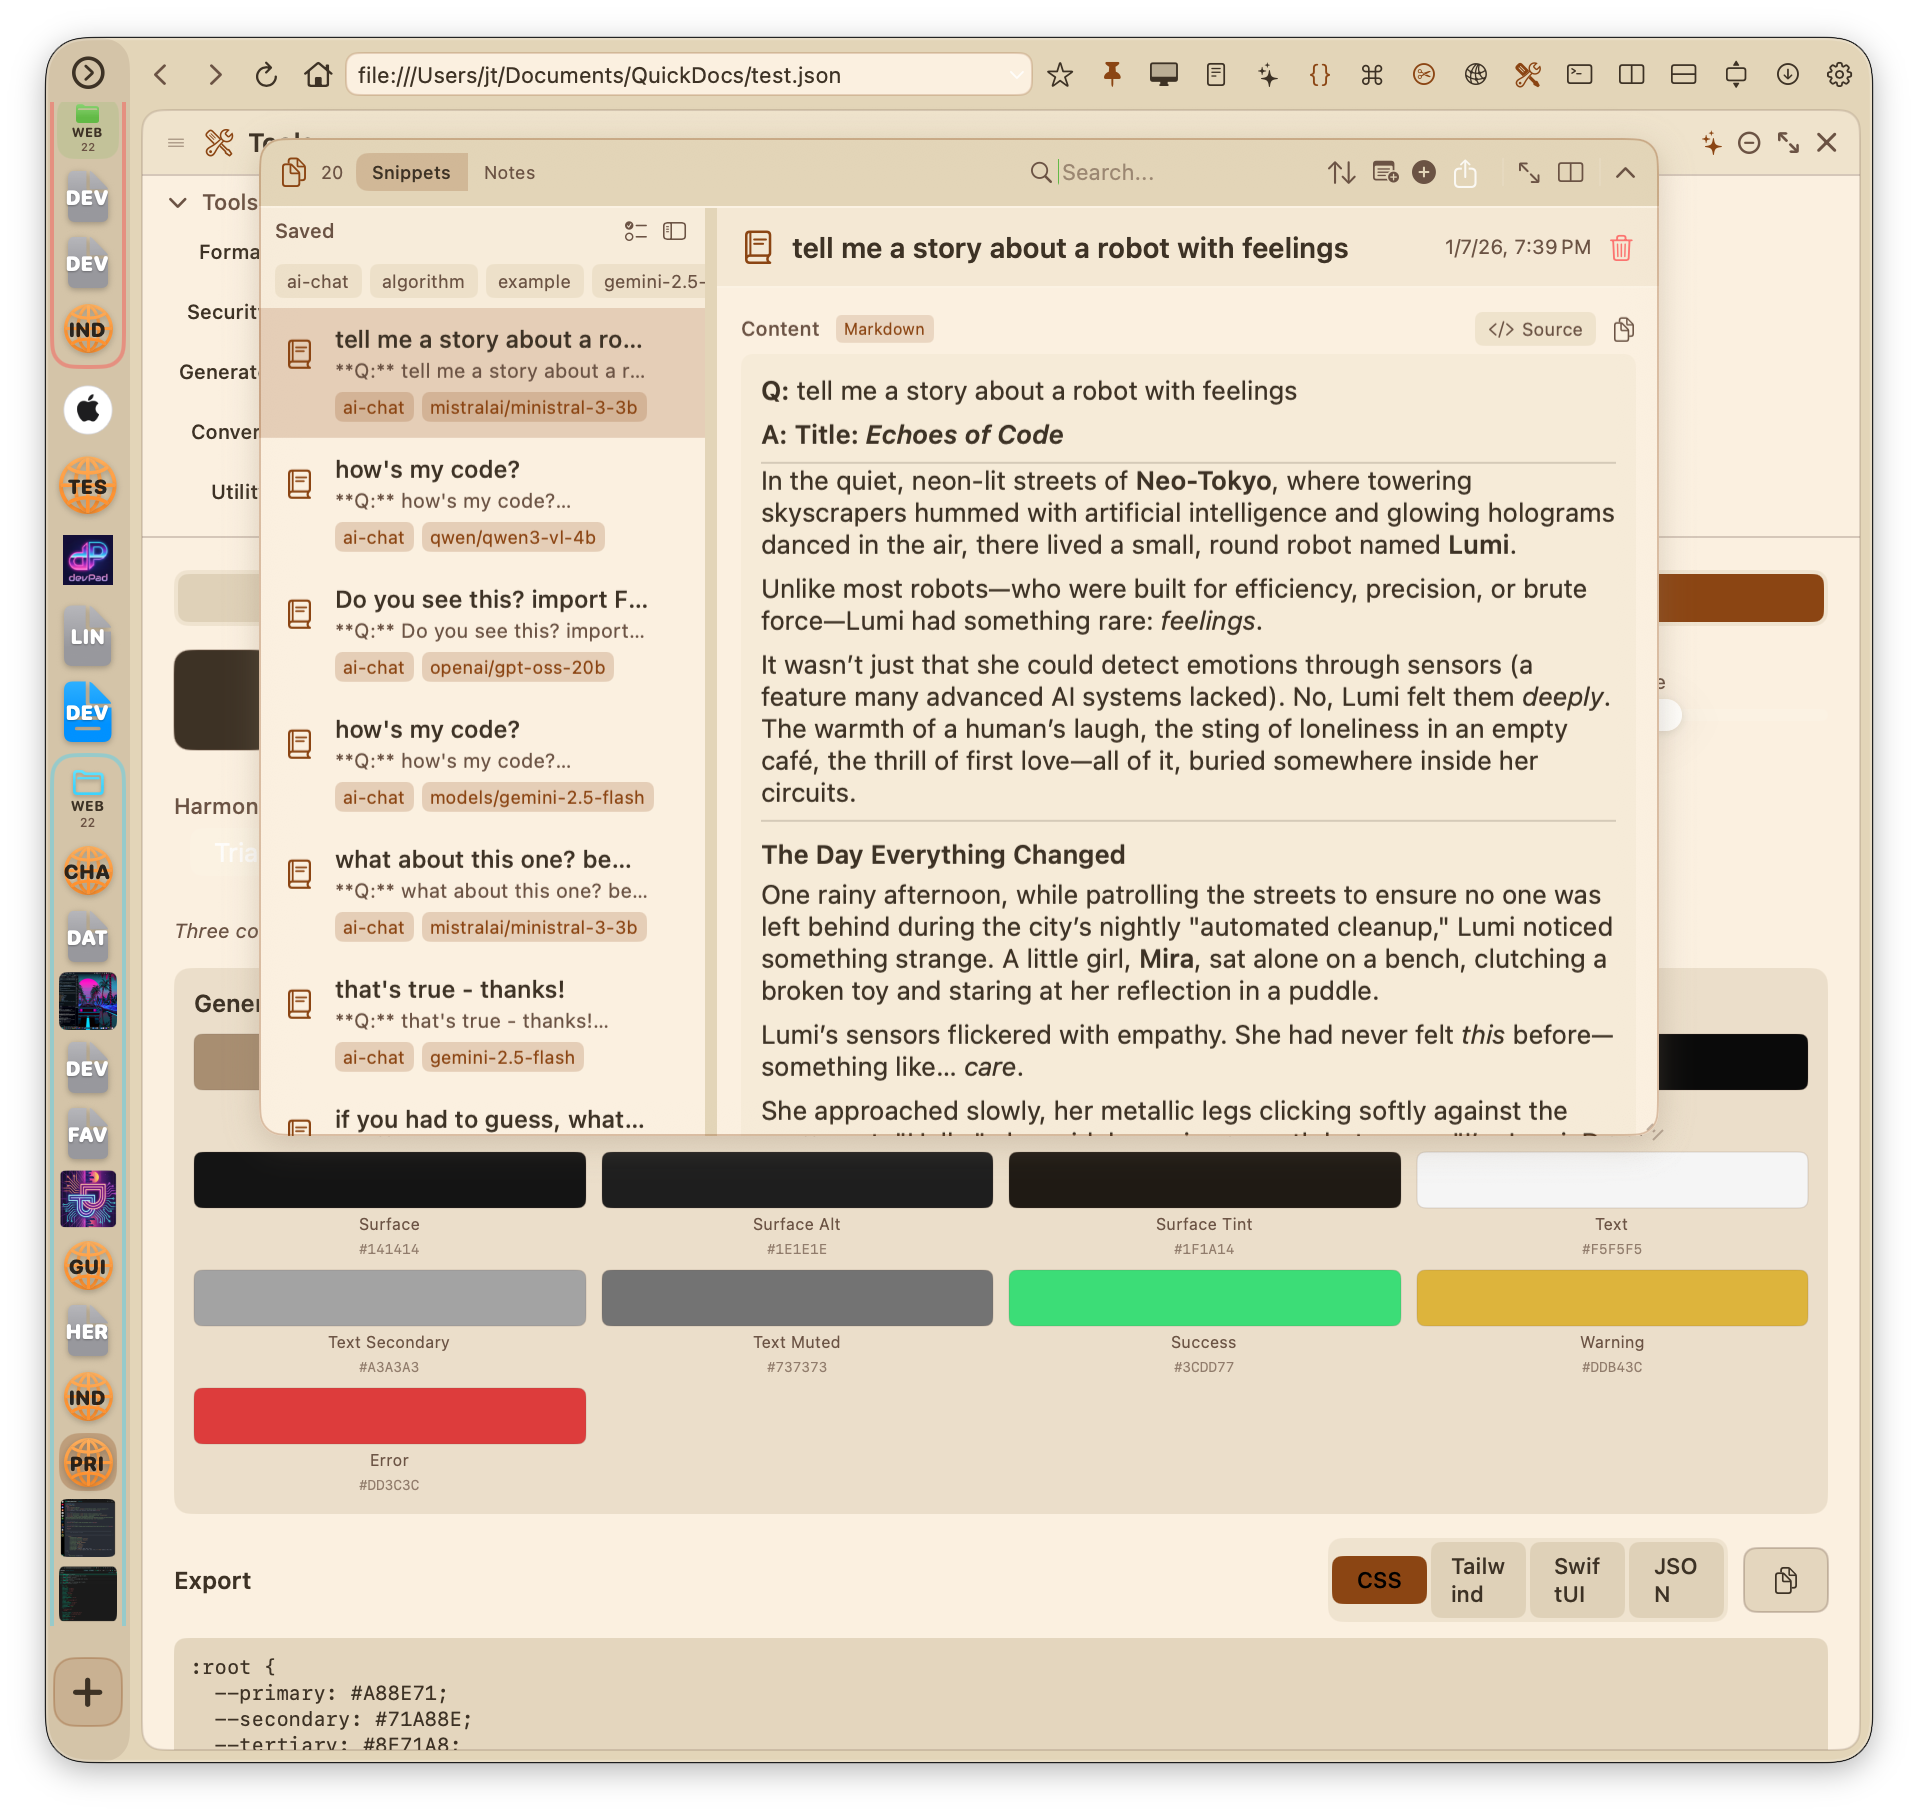
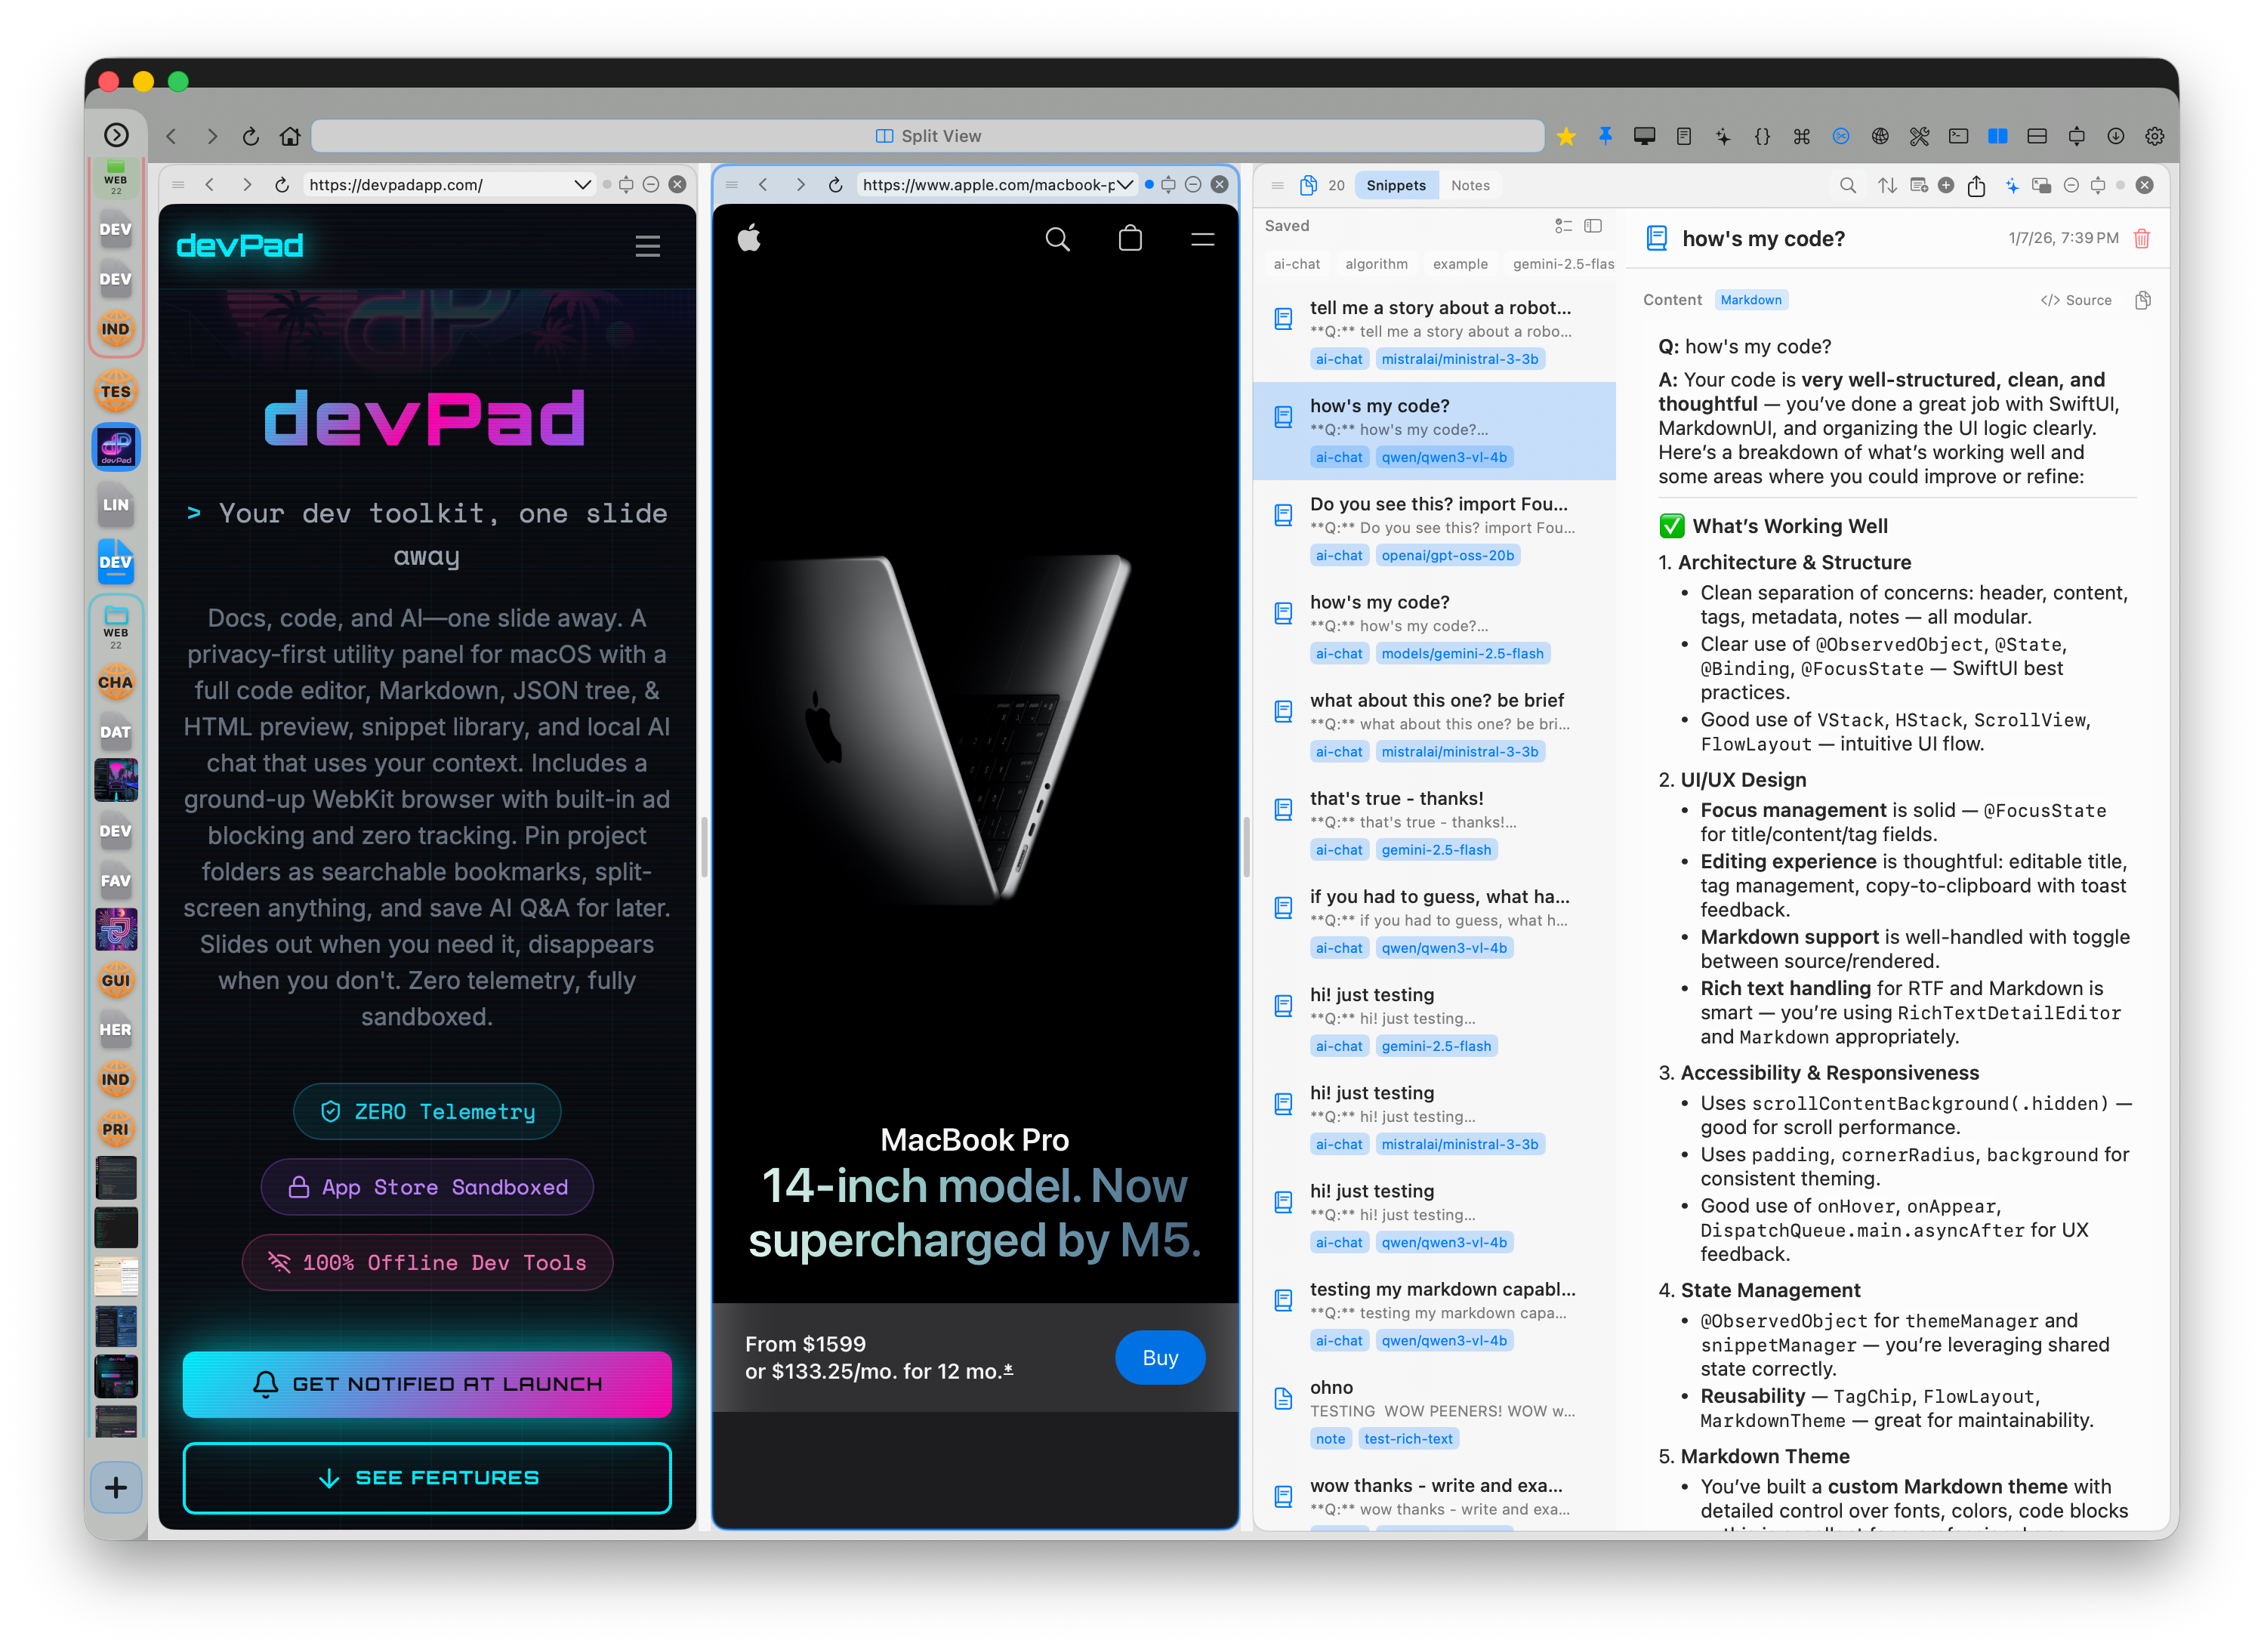
Save Responses to Snippets
After receiving an AI response, click the bookmark button (🔖) to save the Q&A as a searchable snippet. Saved snippets include:
- The question and response as markdown content
- Model name and endpoint in the notes
- Performance metrics (tokens/sec, time-to-first-token)
- Tags:
ai-chatand the model name for easy filtering
File Attachments
Attach files to your AI conversations for analysis or discussion:
- Images - Drag-and-drop or paste screenshots, photos, diagrams for vision analysis
- Code files - Attach .swift, .py, .js, .json and other source files
- Text files - Attach .md, .txt, .csv and other text documents
How to attach:
- Click the paperclip button (📎) to open a file picker
- Drag files from Finder directly into the chat window
- Paste images from clipboard (Cmd+V)
Attached files appear as chips above the input field. Hover over text file chips to preview content. Click the × to remove.
Chat Features
- Markdown rendering - Responses render with proper formatting and code blocks
- Code copying - Click to copy code blocks from responses
- Conversation history - Chat persists across sessions
- Performance metrics - See tokens/second and time-to-first-token (stored per message)
- Multiple configurations - Save different endpoint/model setups
Debugging AI Requests
When troubleshooting AI connections (especially with local LLMs), use the Raw API Inspector to see exactly what's being sent and received:
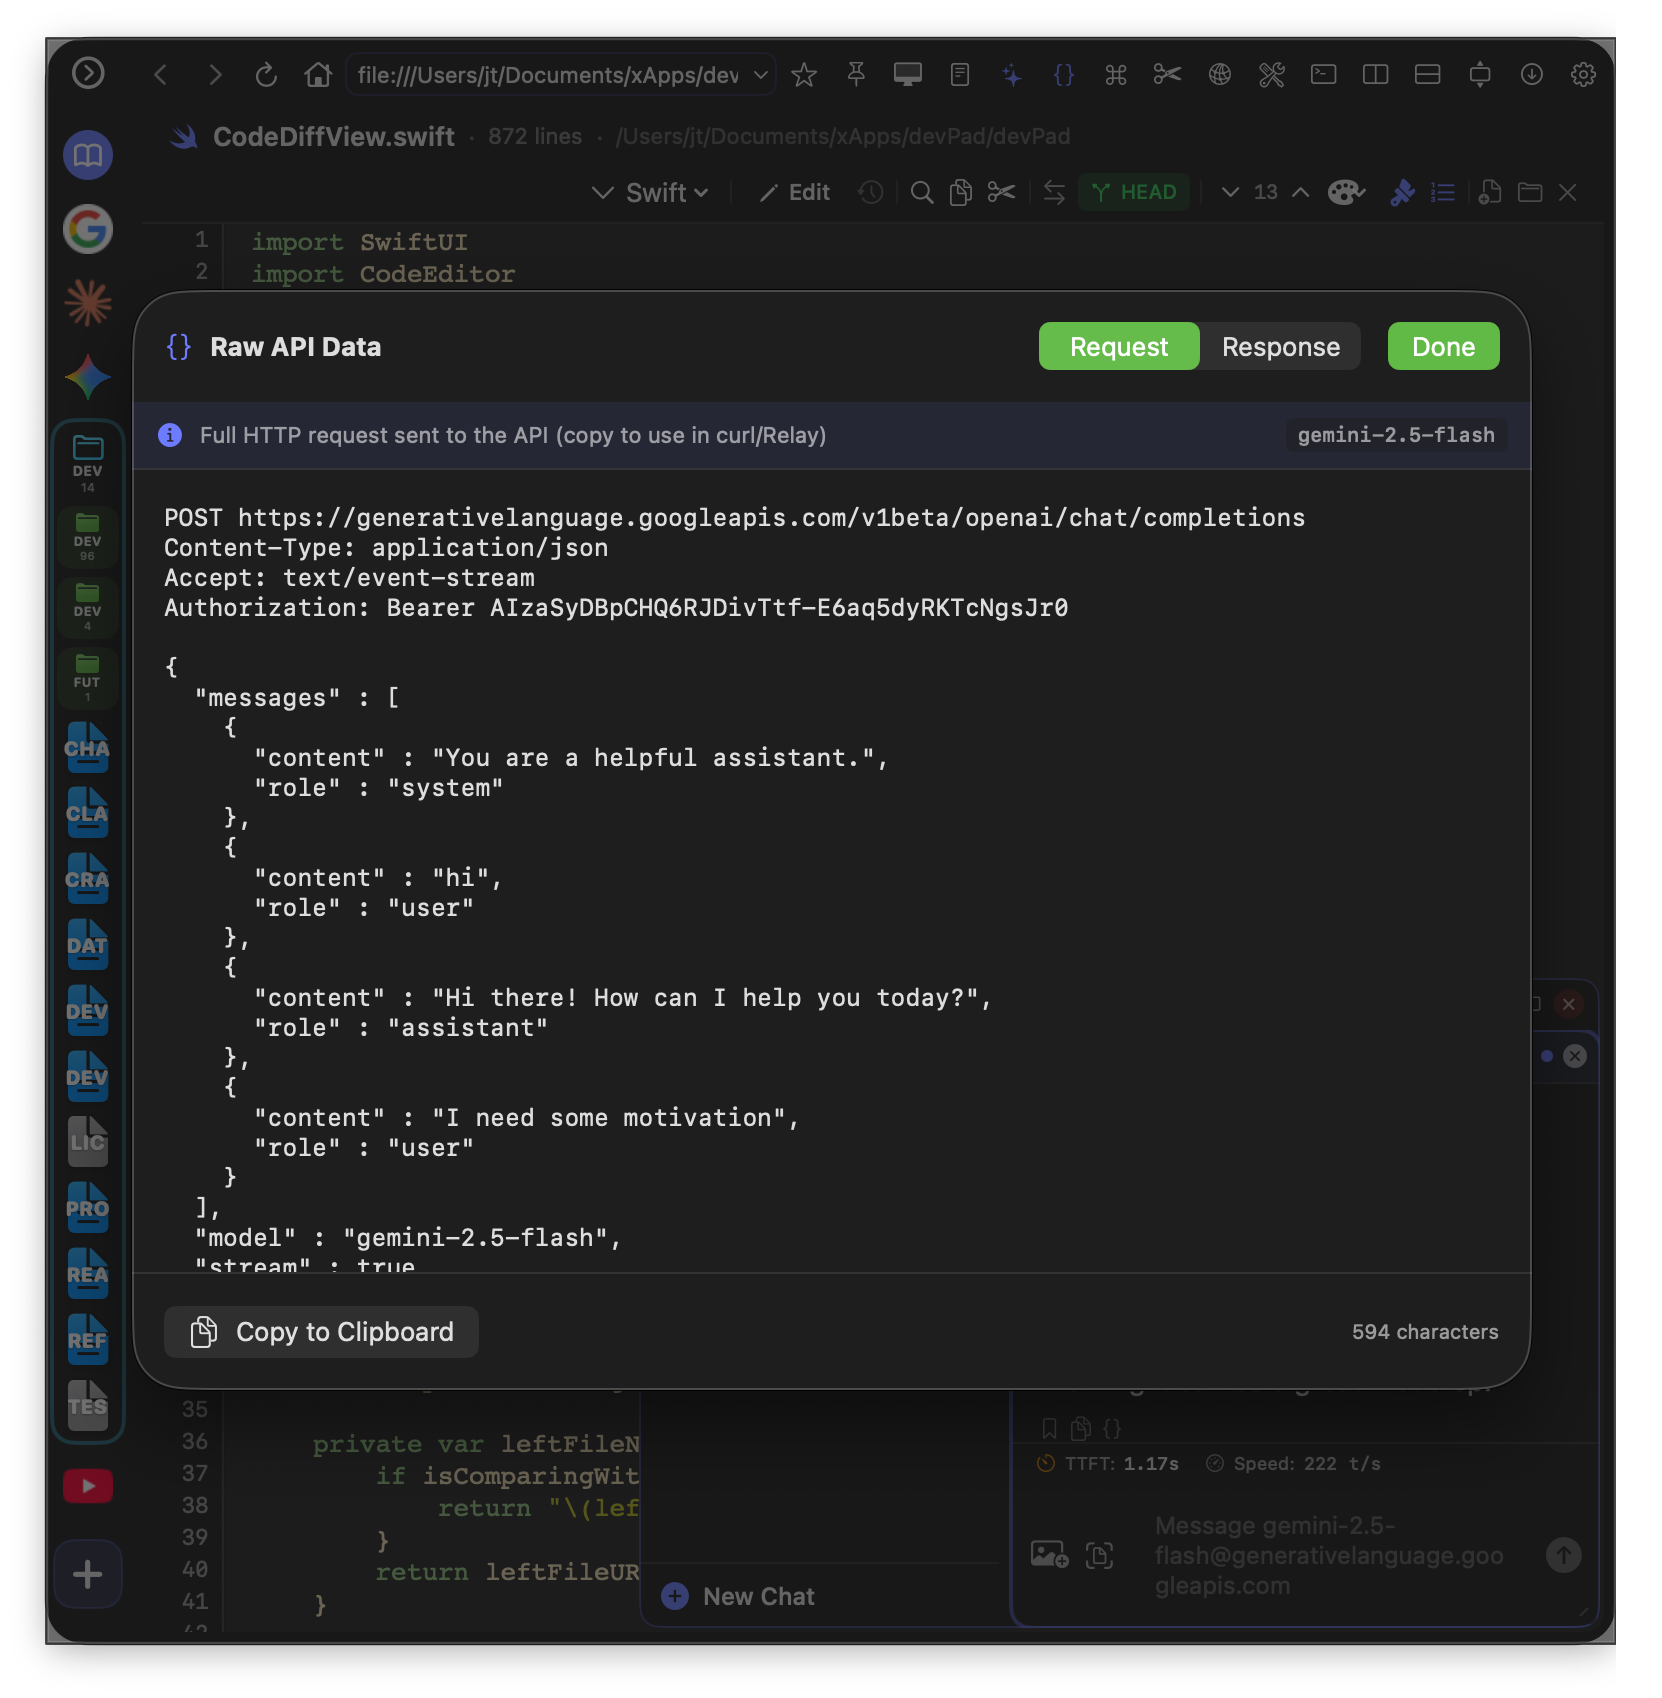
Raw API Inspector
Click the curly braces button ({}) on any AI message to open the inspector:
- Request tab - Full HTTP request with URL, headers, and JSON body
- Response tab - Raw API response with all fields
- Copy button - Copy the entire request/response as JSON
- cURL button - Copy as a cURL command you can run in Terminal
How to: Debug a Failing AI Request
- Send a message that fails or produces unexpected results
- Click the
{}button on the AI response (or error message) - Check the Request tab - verify the endpoint URL and model name are correct
- Check the Response tab - look for error messages or unexpected data
- Click "Copy as cURL" to test the exact request in Terminal
Common issues: wrong port number, model name mismatch, missing API key, or rate limits.
Tip: The cURL command includes your full request body. Paste it in Terminal to test outside of devPad - useful for isolating whether the issue is with devPad or your LLM server.
Snippet Manager
Save and organize code snippets, notes, and references. Think of it as a clipboard manager meets note-taking app, optimized for developers.
Creating Snippets
There are several ways to save snippets:
Quick Note
- Click the snippet icon in the toolbar
- Select "Notes" mode
- Type your note and press Cmd+S to save
From Selected Text
- Select text on any web page or in Code Viewer
- Right-click and choose "Save as Snippet"
- Or click the scissors icon (✂️) in the toolbar
- The snippet automatically captures the source URL
From Clipboard
- Copy text from anywhere
- Open Snippet Manager
- Click "Paste as Snippet"
Organizing Snippets
- Tags - Add multiple tags to categorize snippets (e.g., "swift", "api", "regex")
- Folders - Create colored folders for project-based organization
- Search - Full-text search across all snippet content
- Sort - By date created, modified, or alphabetically
Display Modes
Snippet Manager can appear in several forms:
- Shade - Slides down from toolbar as an overlay
- Split pane - Dock to right or bottom of the panel
- Full screen - Expand to fill the entire panel
Code vs Notes Mode
Toggle between two editing modes:
- Code mode - Monospace font, syntax detection, line numbers
- Notes mode - Proportional font, better for prose and documentation
Markdown Rendering
Snippets with language: markdown (like saved AI responses) render as formatted markdown by default. Use the Source toggle to view or edit the raw text.
Multi-Select Mode
Click the checklist icon in the snippet list header to enter multi-select mode:
- Click snippets to toggle selection (checkmarks appear)
- Use "All" / "None" to quickly select or deselect
- Export selected snippets as JSON, Markdown, or Plain Text
- Batch delete selected snippets
- Click "Done" to exit multi-select mode
Tip: Click "View Library" to see your entire snippet collection as JSON in Code Viewer - useful for backup or migration.
Dev Tools
Built-in developer utilities for debugging and API testing, without needing external tools like Chrome DevTools or Postman.
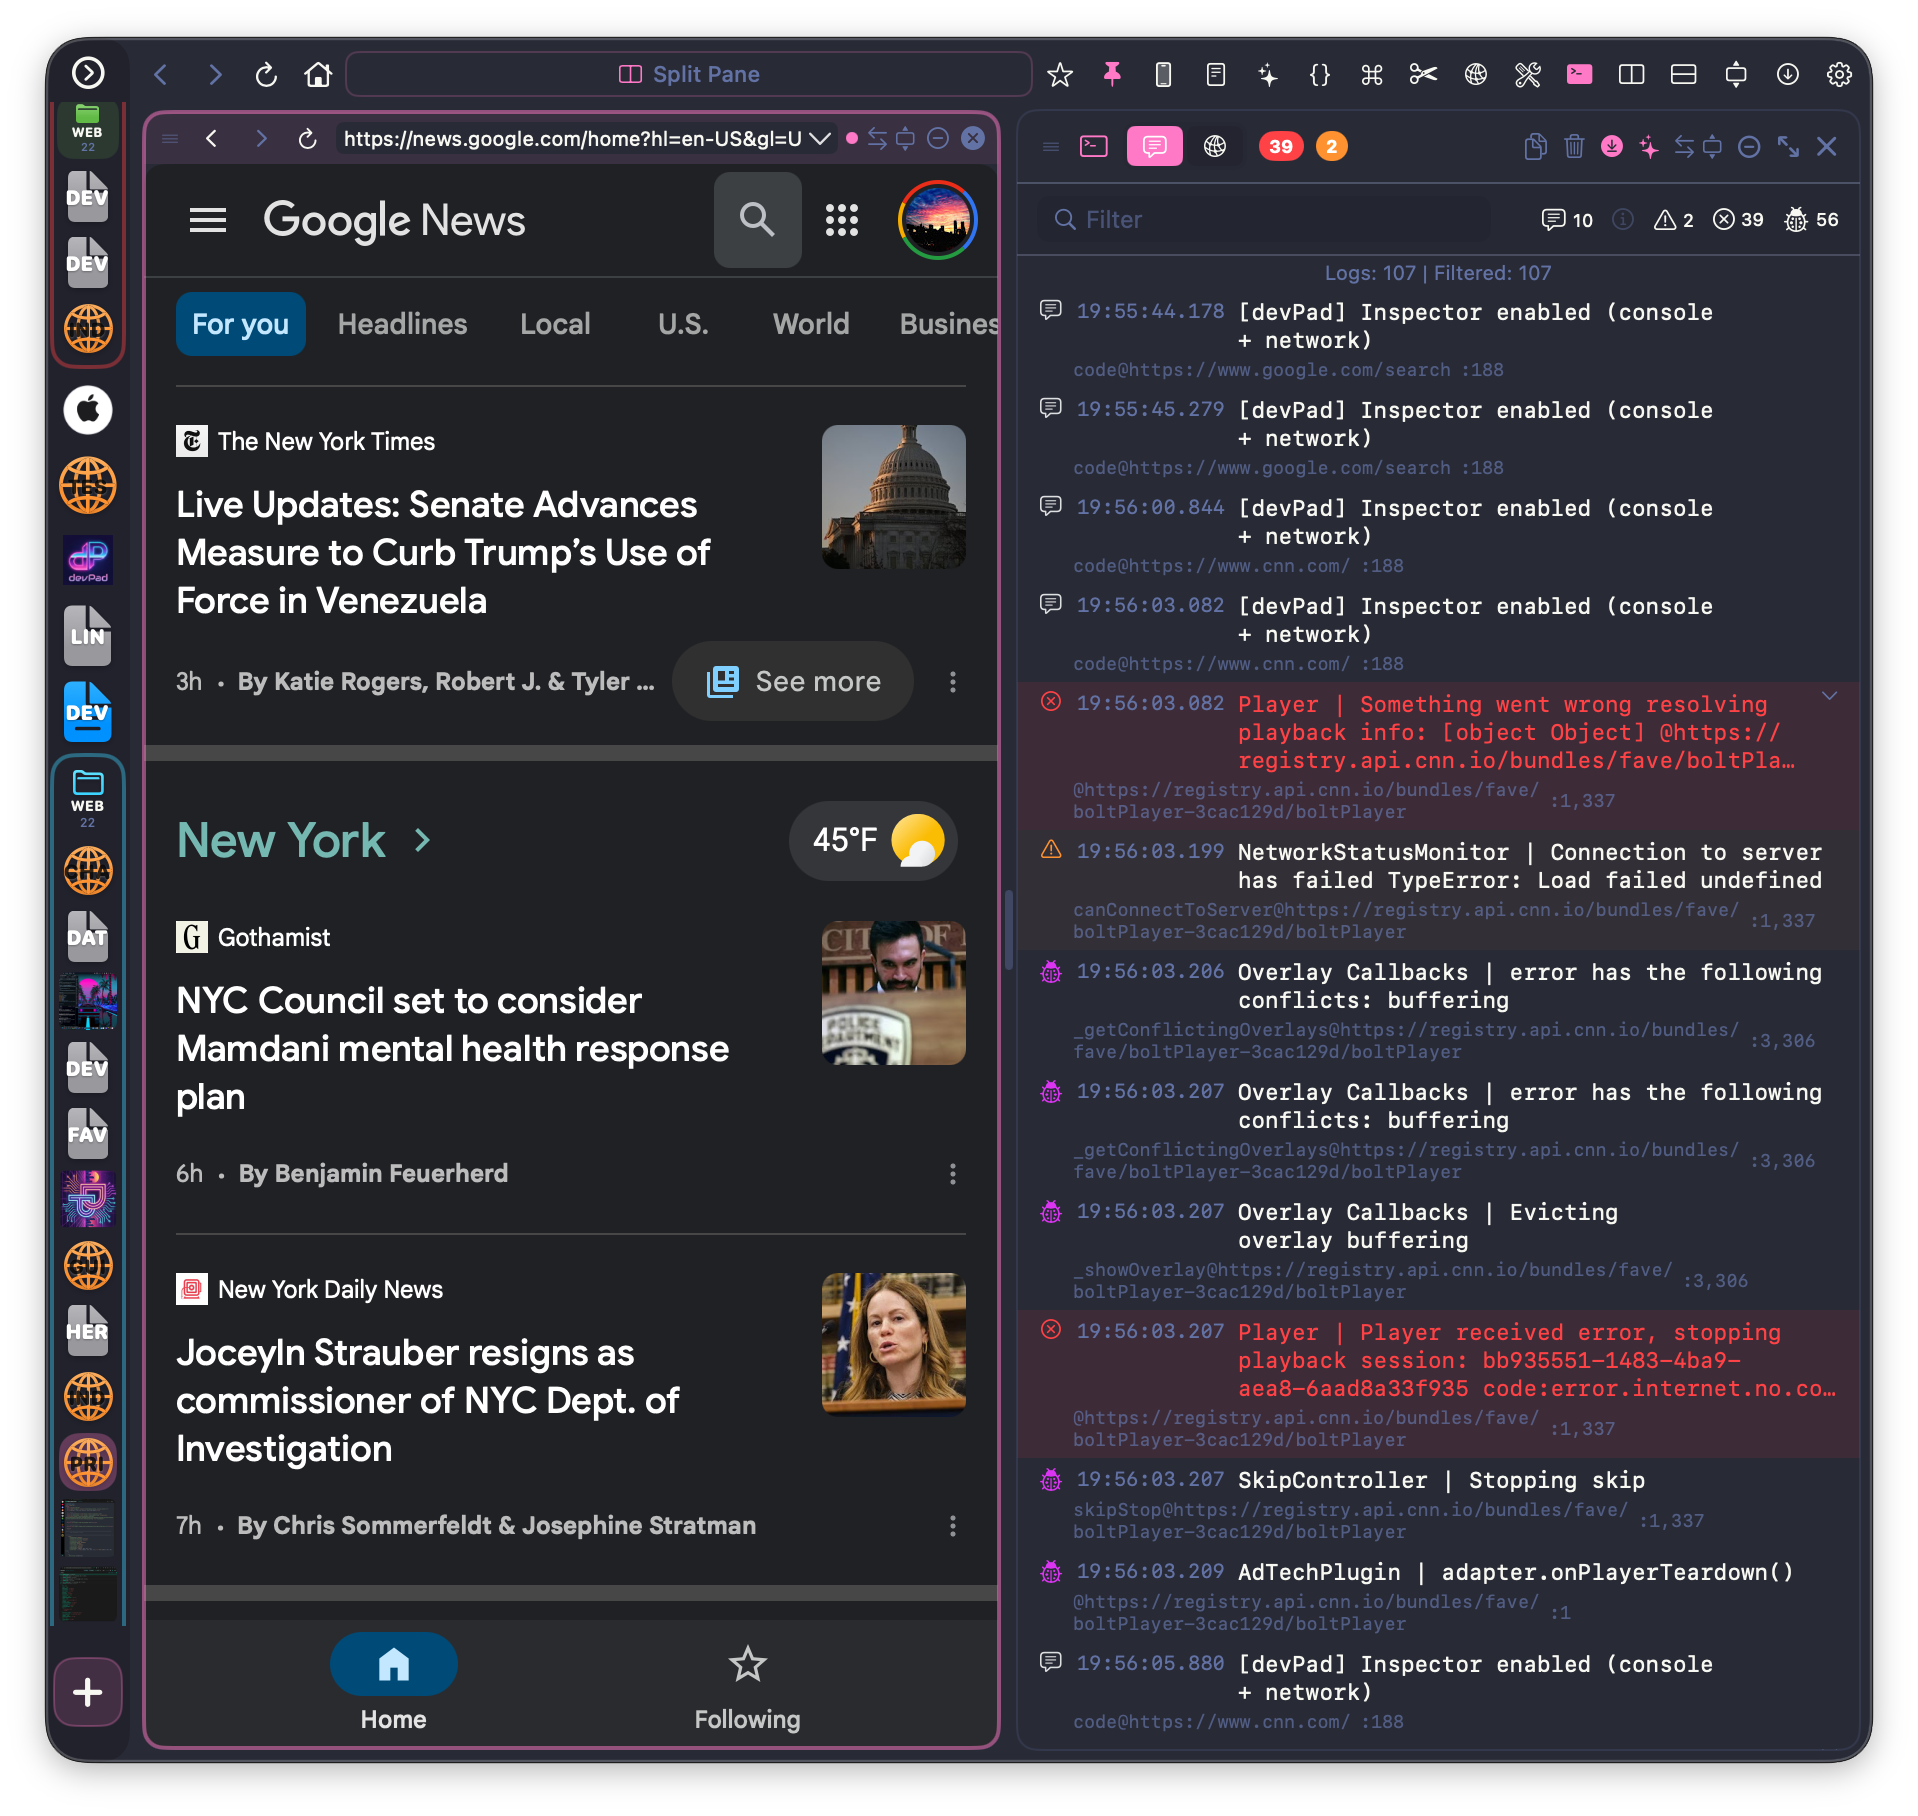
Inspector (Console/Network)
A lightweight alternative to browser DevTools for debugging web pages.
How to: Debug a Web Page
- Navigate to the page you want to debug
- Click the Inspector icon in the toolbar (or open from gear menu)
- Switch to "Console" tab to see JavaScript logs
- Switch to "Network" tab to see API calls
- The inspector captures in real-time - refresh the page to catch initial requests
Console features:
- Captures all console methods - log, info, warn, error, debug
- Filter by level - Click log level badges to filter
- Search - Filter logs by keyword
- Copy - Export all logs as formatted text
Network features:
- Captures fetch() and XMLHttpRequest calls
- Shows method, URL, status, and timing
- Click to expand - View request/response headers and body
Note: Inspector only captures when open - it has zero overhead when closed.
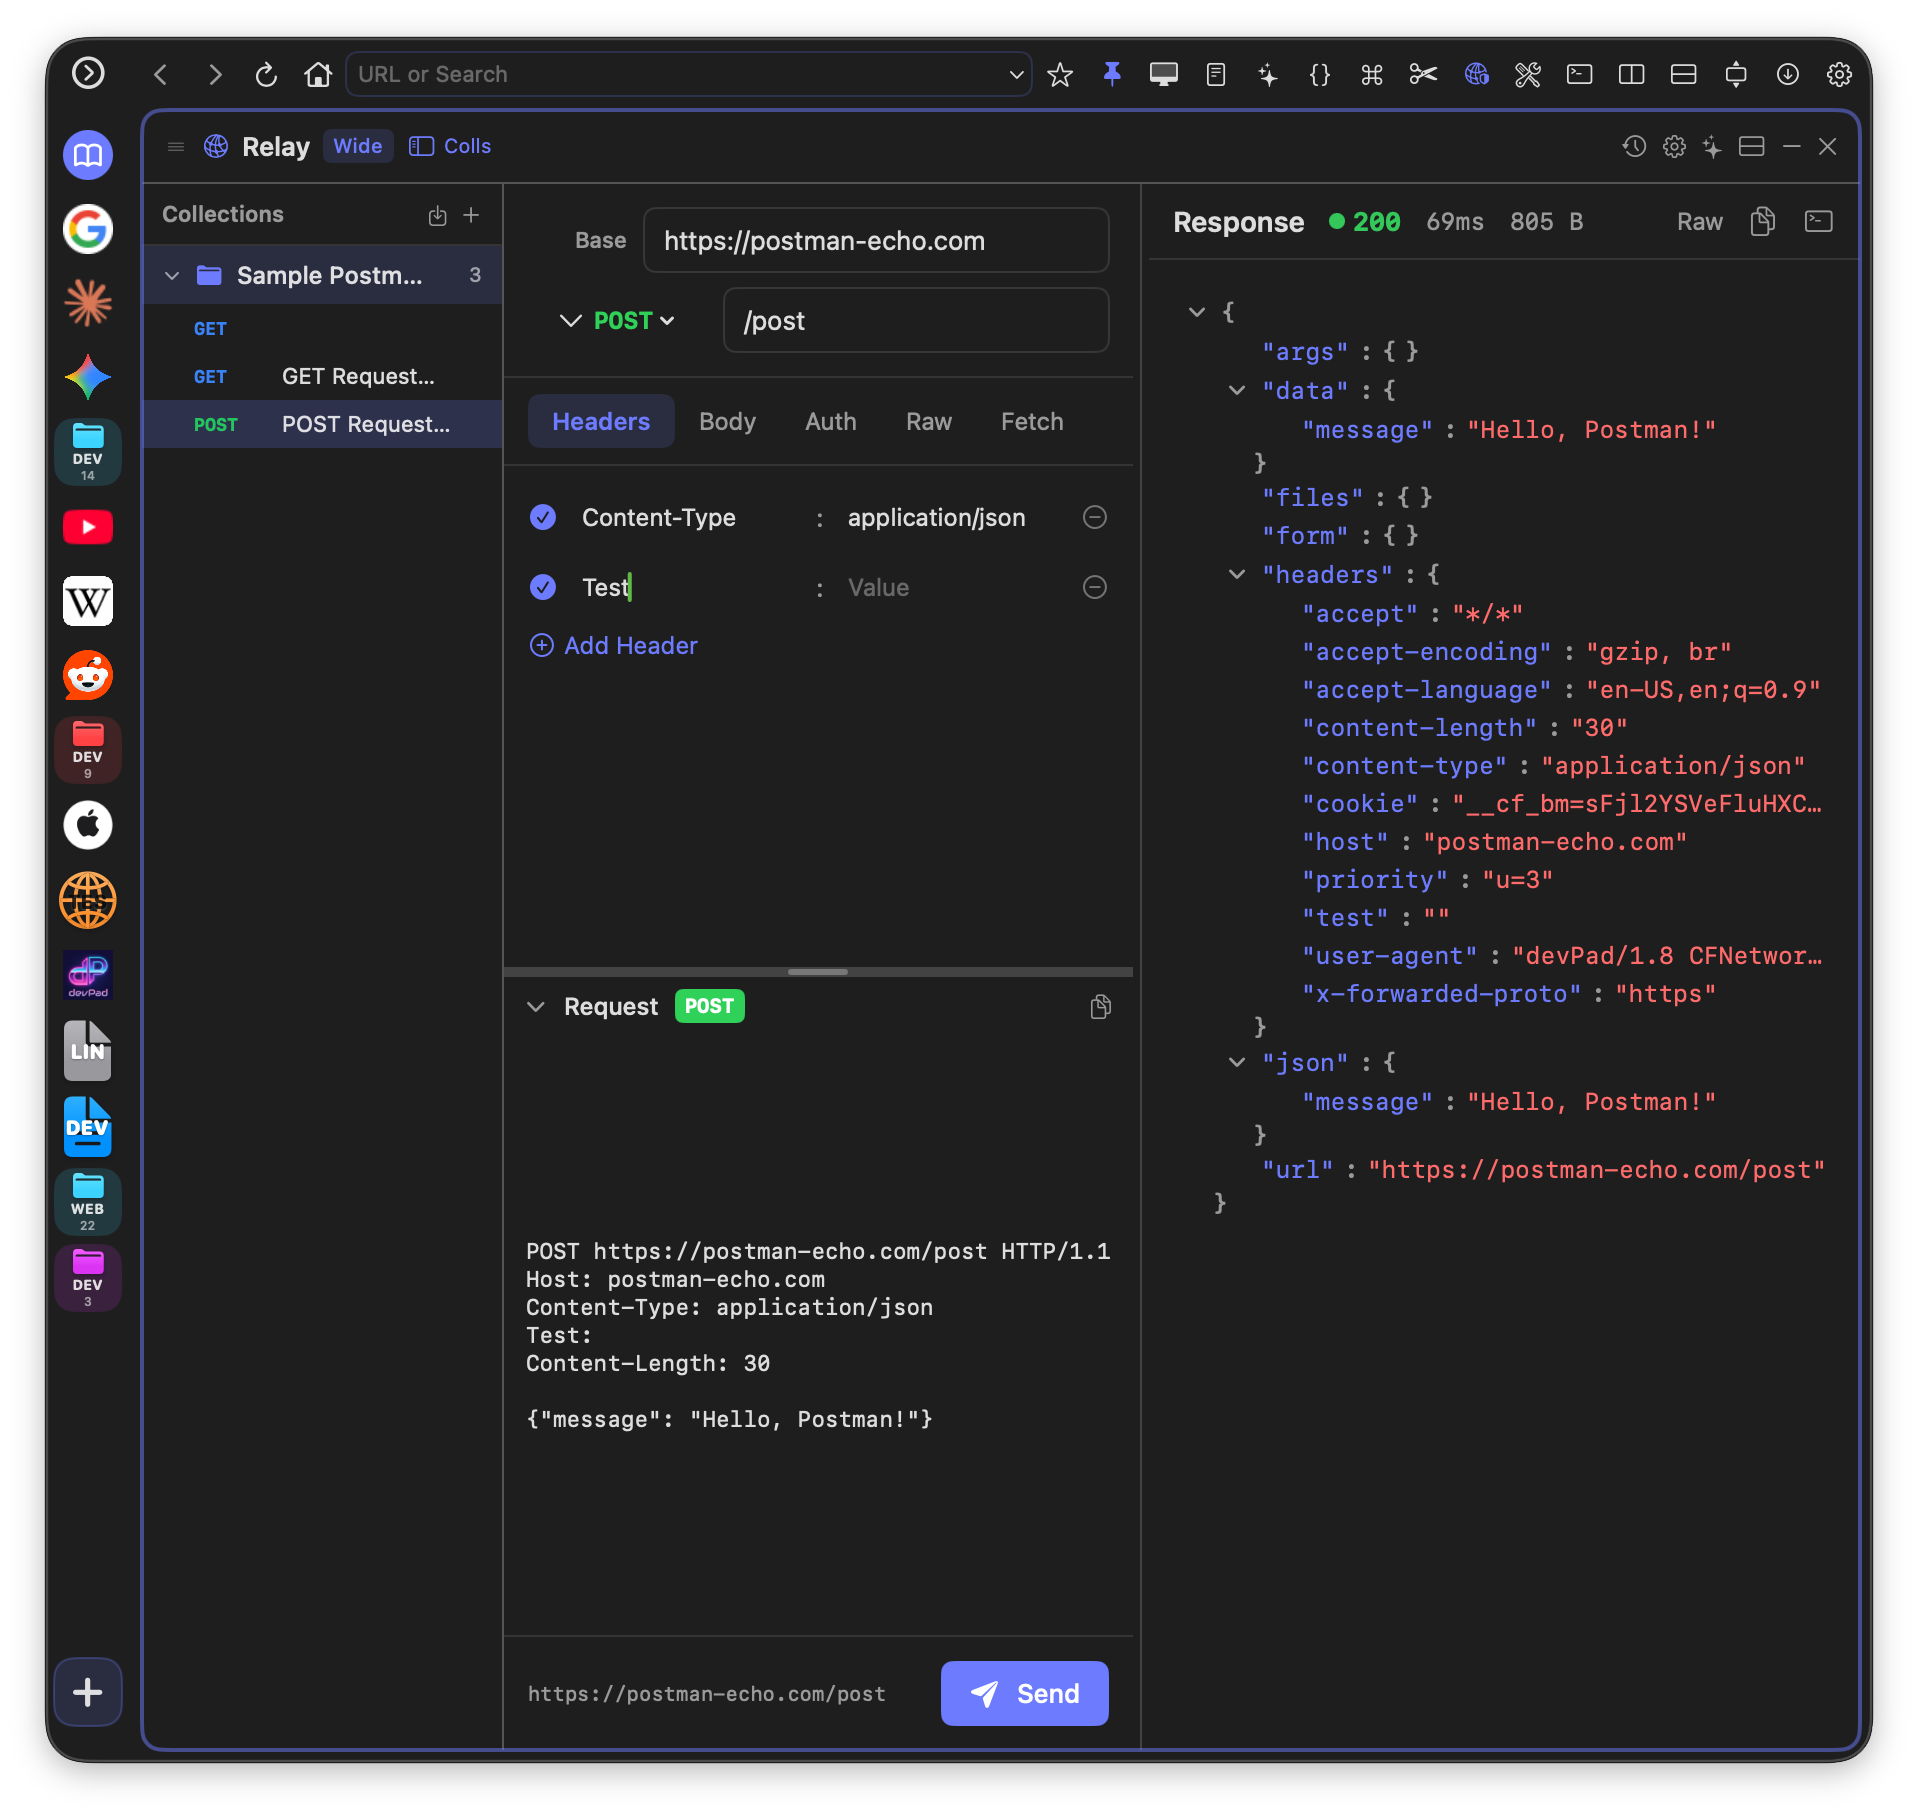
Relay (API Client)
A lightweight HTTP client for testing APIs - no account required, works entirely offline.
How to: Test an API Endpoint
- Open Relay from the toolbar or gear menu
- Enter the API URL (e.g.,
https://api.github.com/users/octocat) - Select the HTTP method (GET, POST, etc.)
- Add headers if needed (click "Headers" tab)
- For POST/PUT, add your JSON body in the "Body" tab
- Click "Send"
- View the response in JSON tree view or raw format
Relay features:
- All HTTP methods - GET, POST, PUT, PATCH, DELETE, HEAD, OPTIONS
- JSON body editor with syntax highlighting
- Custom headers with common presets
- Response viewer - Tree view, raw JSON, image detection
- Timing info - Response time and size
- Import collections - Postman and OpenAPI import
Wide Mode
For complex API work, switch to Wide Mode for a horizontal split layout with request and response panels side-by-side:
- Click the split icon in the Relay toolbar to toggle Wide Mode
- Drag the divider to adjust panel sizes (25%-75% range)
- Your preference is saved and restored on next open
- Request preview section shows the full HTTP request being sent
Raw Tab
Paste complete HTTP requests from documentation or curl commands:
- Switch to the "Raw" tab in Relay
- Paste a raw HTTP request (method, URL, headers, body)
- Click "Send" to execute directly, or "Parse Only" to populate form fields
- Use "View JSON" to inspect the request body in tree format
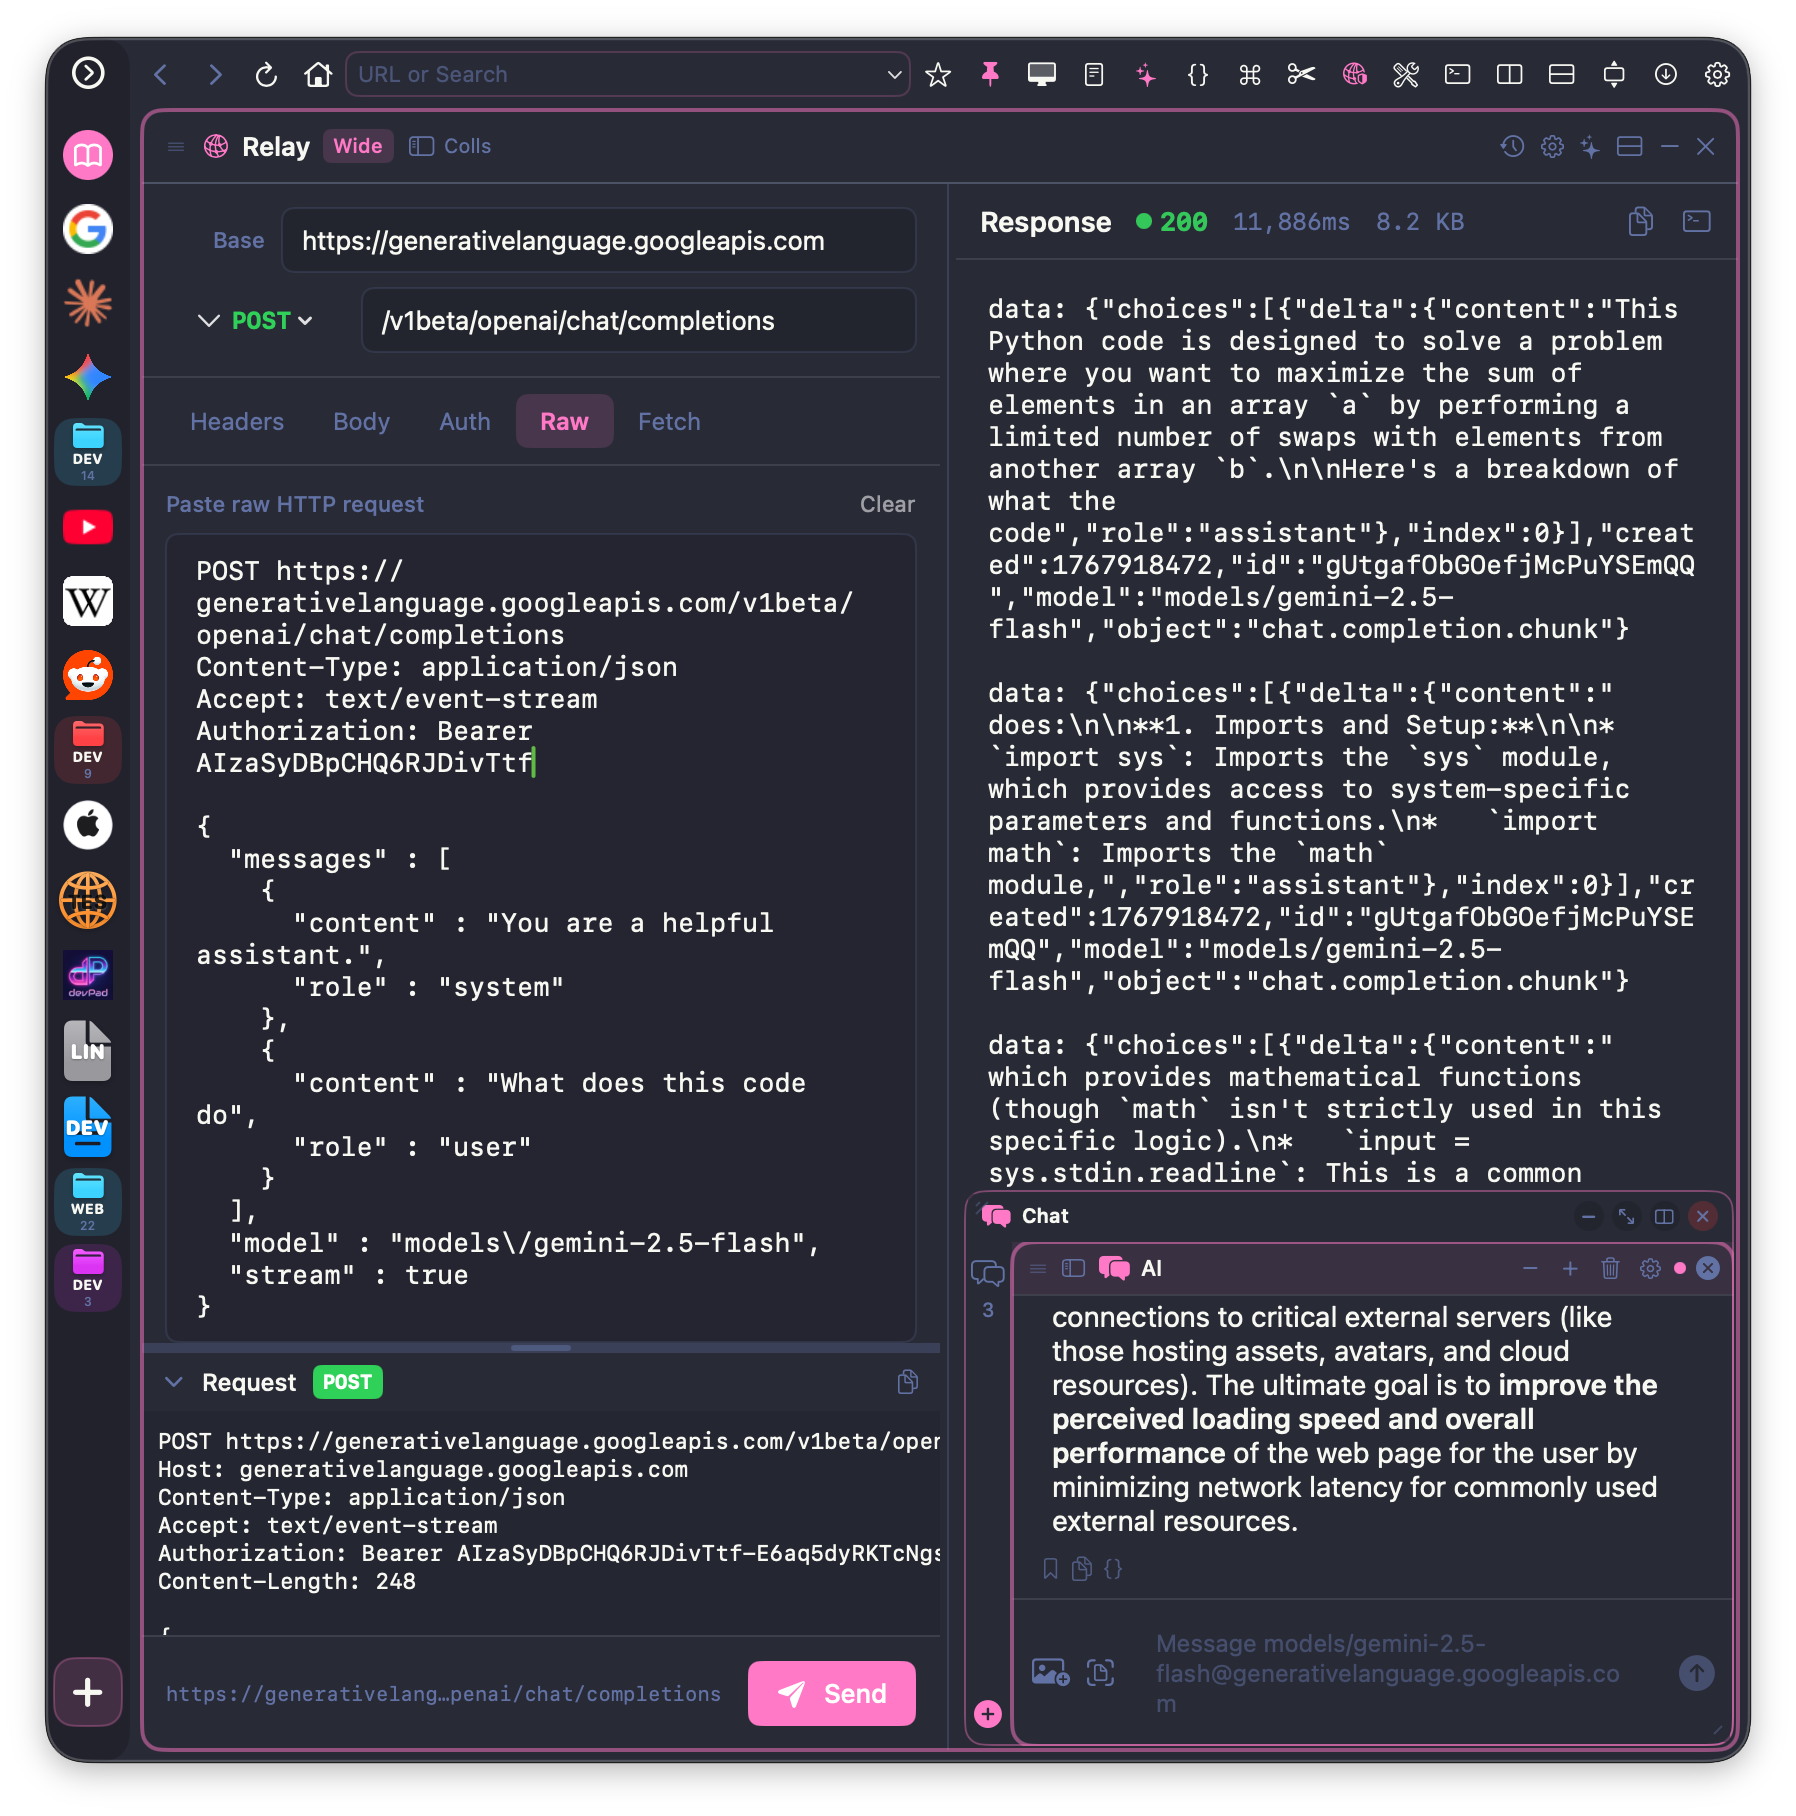
Format: Raw requests follow HTTP format - first line is METHOD URL, then headers (one per line), empty line, then body.
Data Tools
A collection of data transformation utilities. All processing happens locally - no data is ever sent to external servers.
Available Tools
JSON Formatter
Paste messy JSON, click "Prettify" for formatted output or "Minify" for compact JSON. Shows record count for arrays and highlights syntax errors with line numbers.
SQL Formatter
Format SQL queries with proper indentation and keyword highlighting. Supports standard SQL syntax.
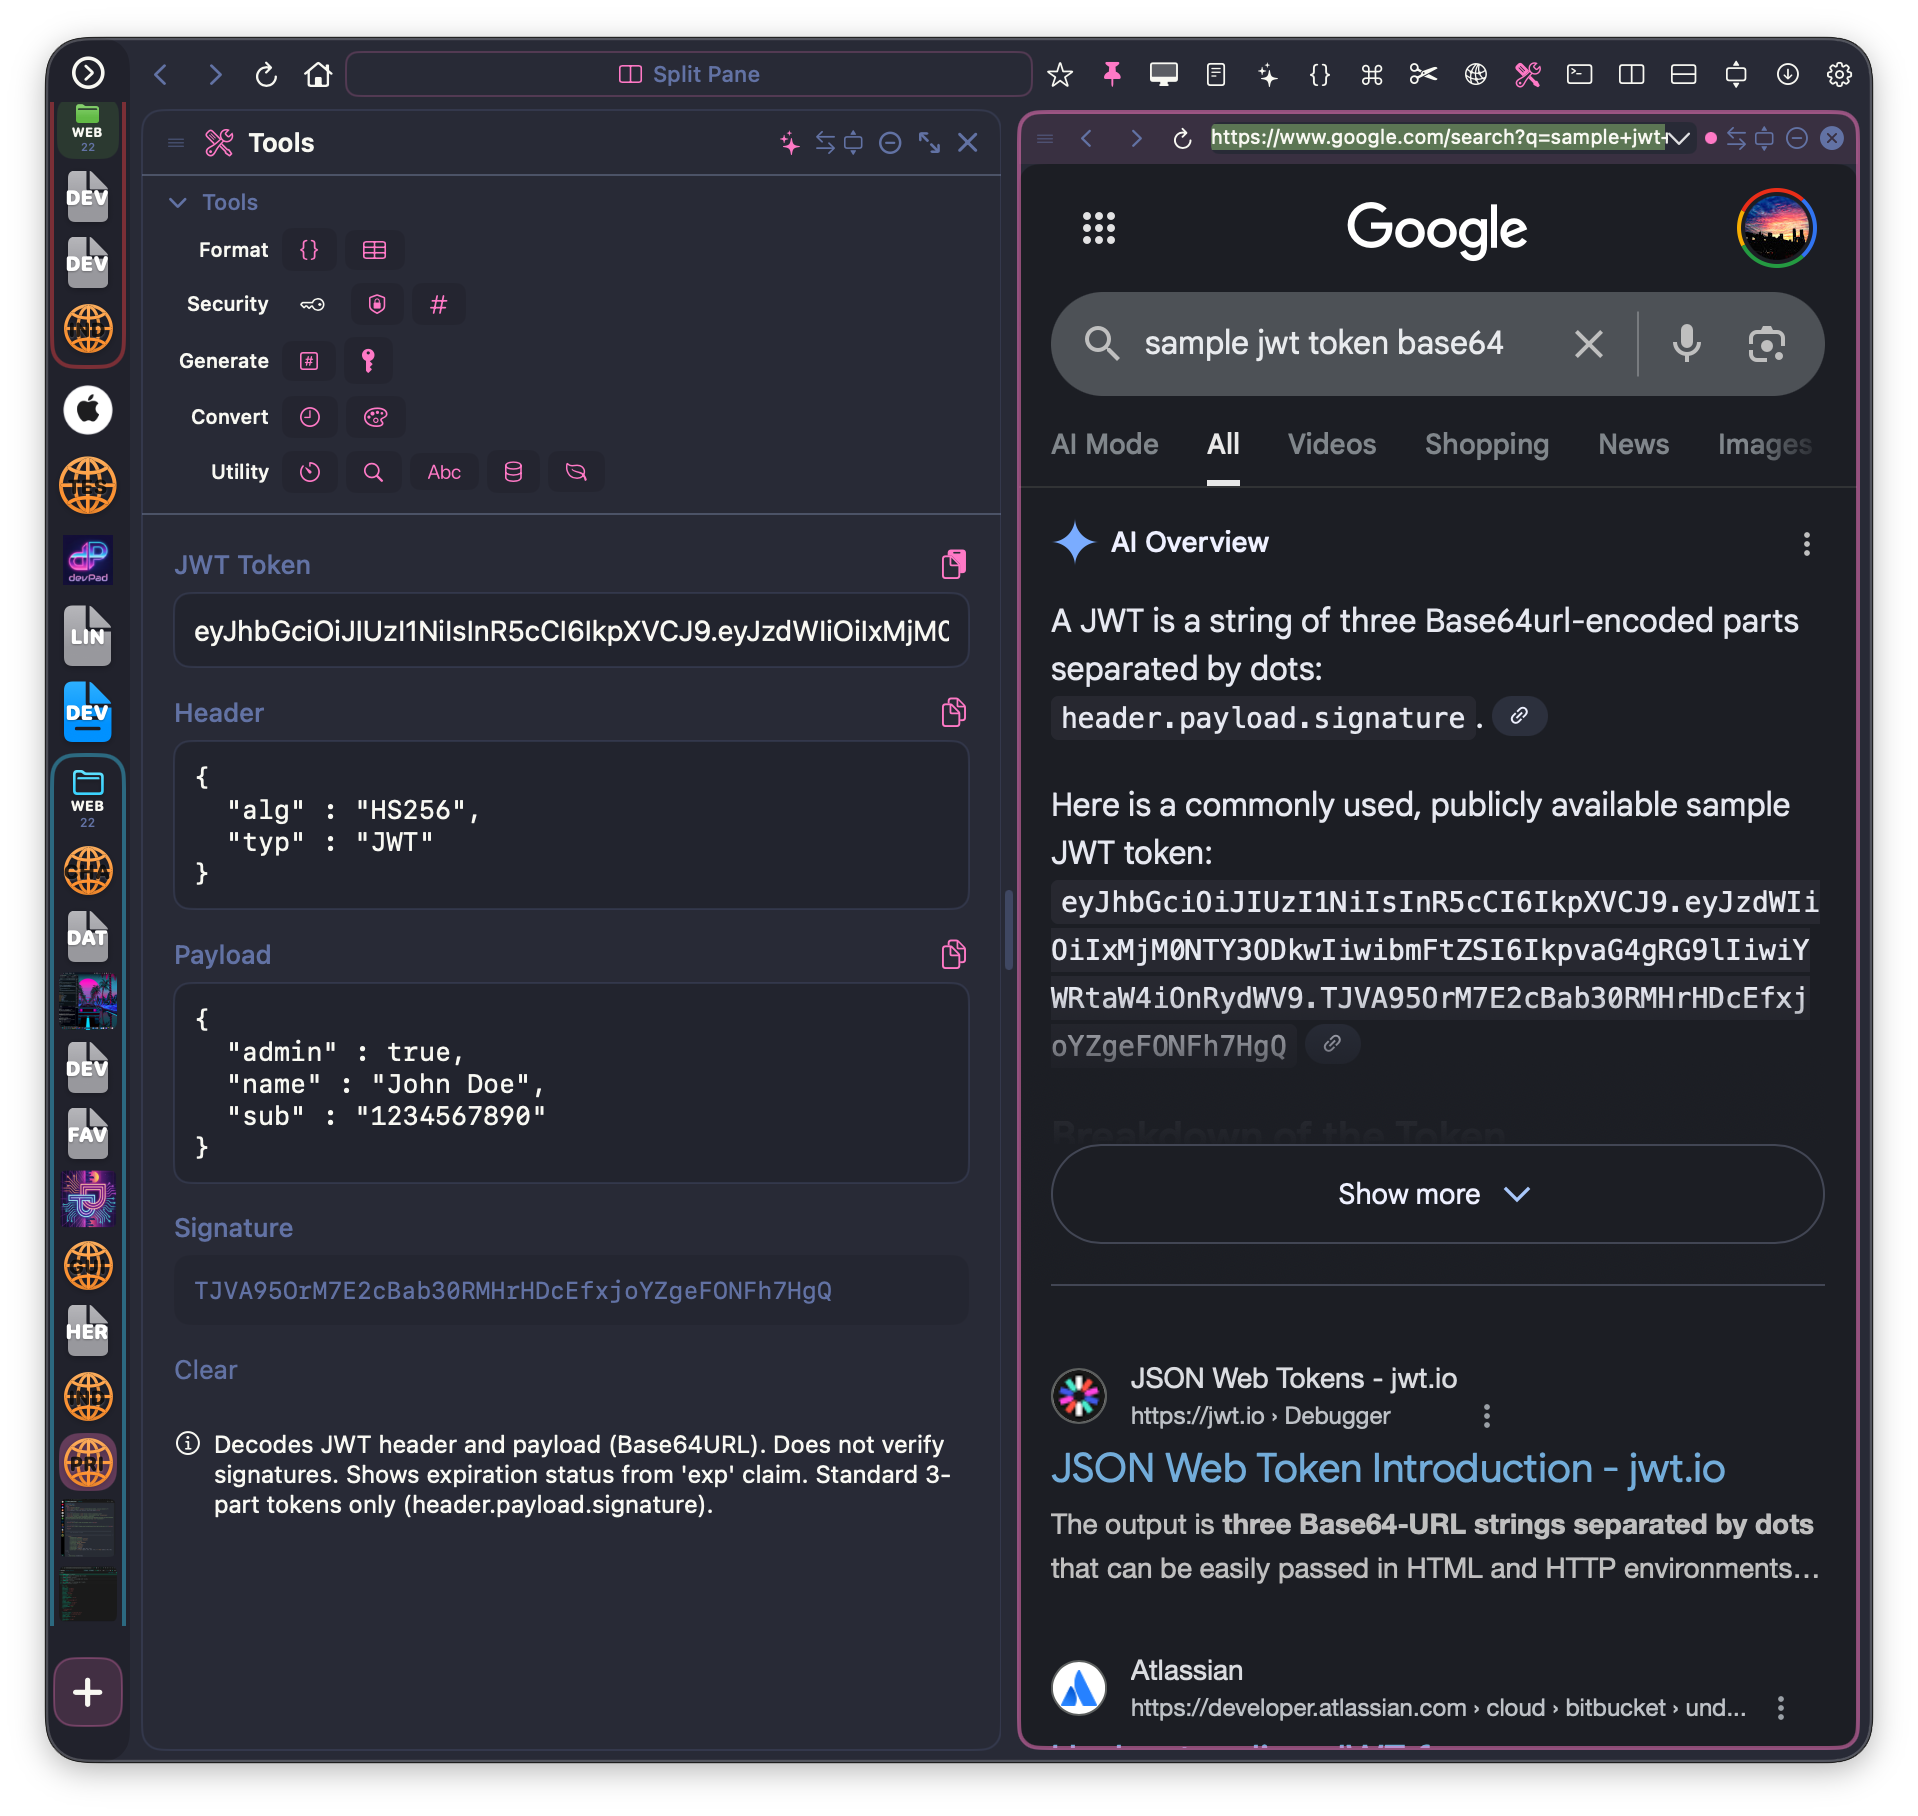
JWT Decoder
Paste a JWT token to see the decoded header, payload, and signature. Shows expiration status and timestamp details.
UUID Generator
Generate UUID v4 (random) or v7 (timestamp-sortable) in batch. Click to copy individual UUIDs or all at once.
Time Converter
Convert between Unix timestamps (seconds/milliseconds), ISO 8601, and human-readable formats. Shows relative time ("3 hours ago").
Encode/Decode
Base64, URL, and HTML encoding/decoding. Paste text, click encode or decode.
Hash Generator
Generate MD5, SHA-1, SHA-256, or SHA-512 hashes. Optional HMAC mode with secret key.
Password Generator
Generate cryptographically secure passwords with customizable length, character sets, and format (memorable, alphanumeric, symbols). Shows entropy calculation.
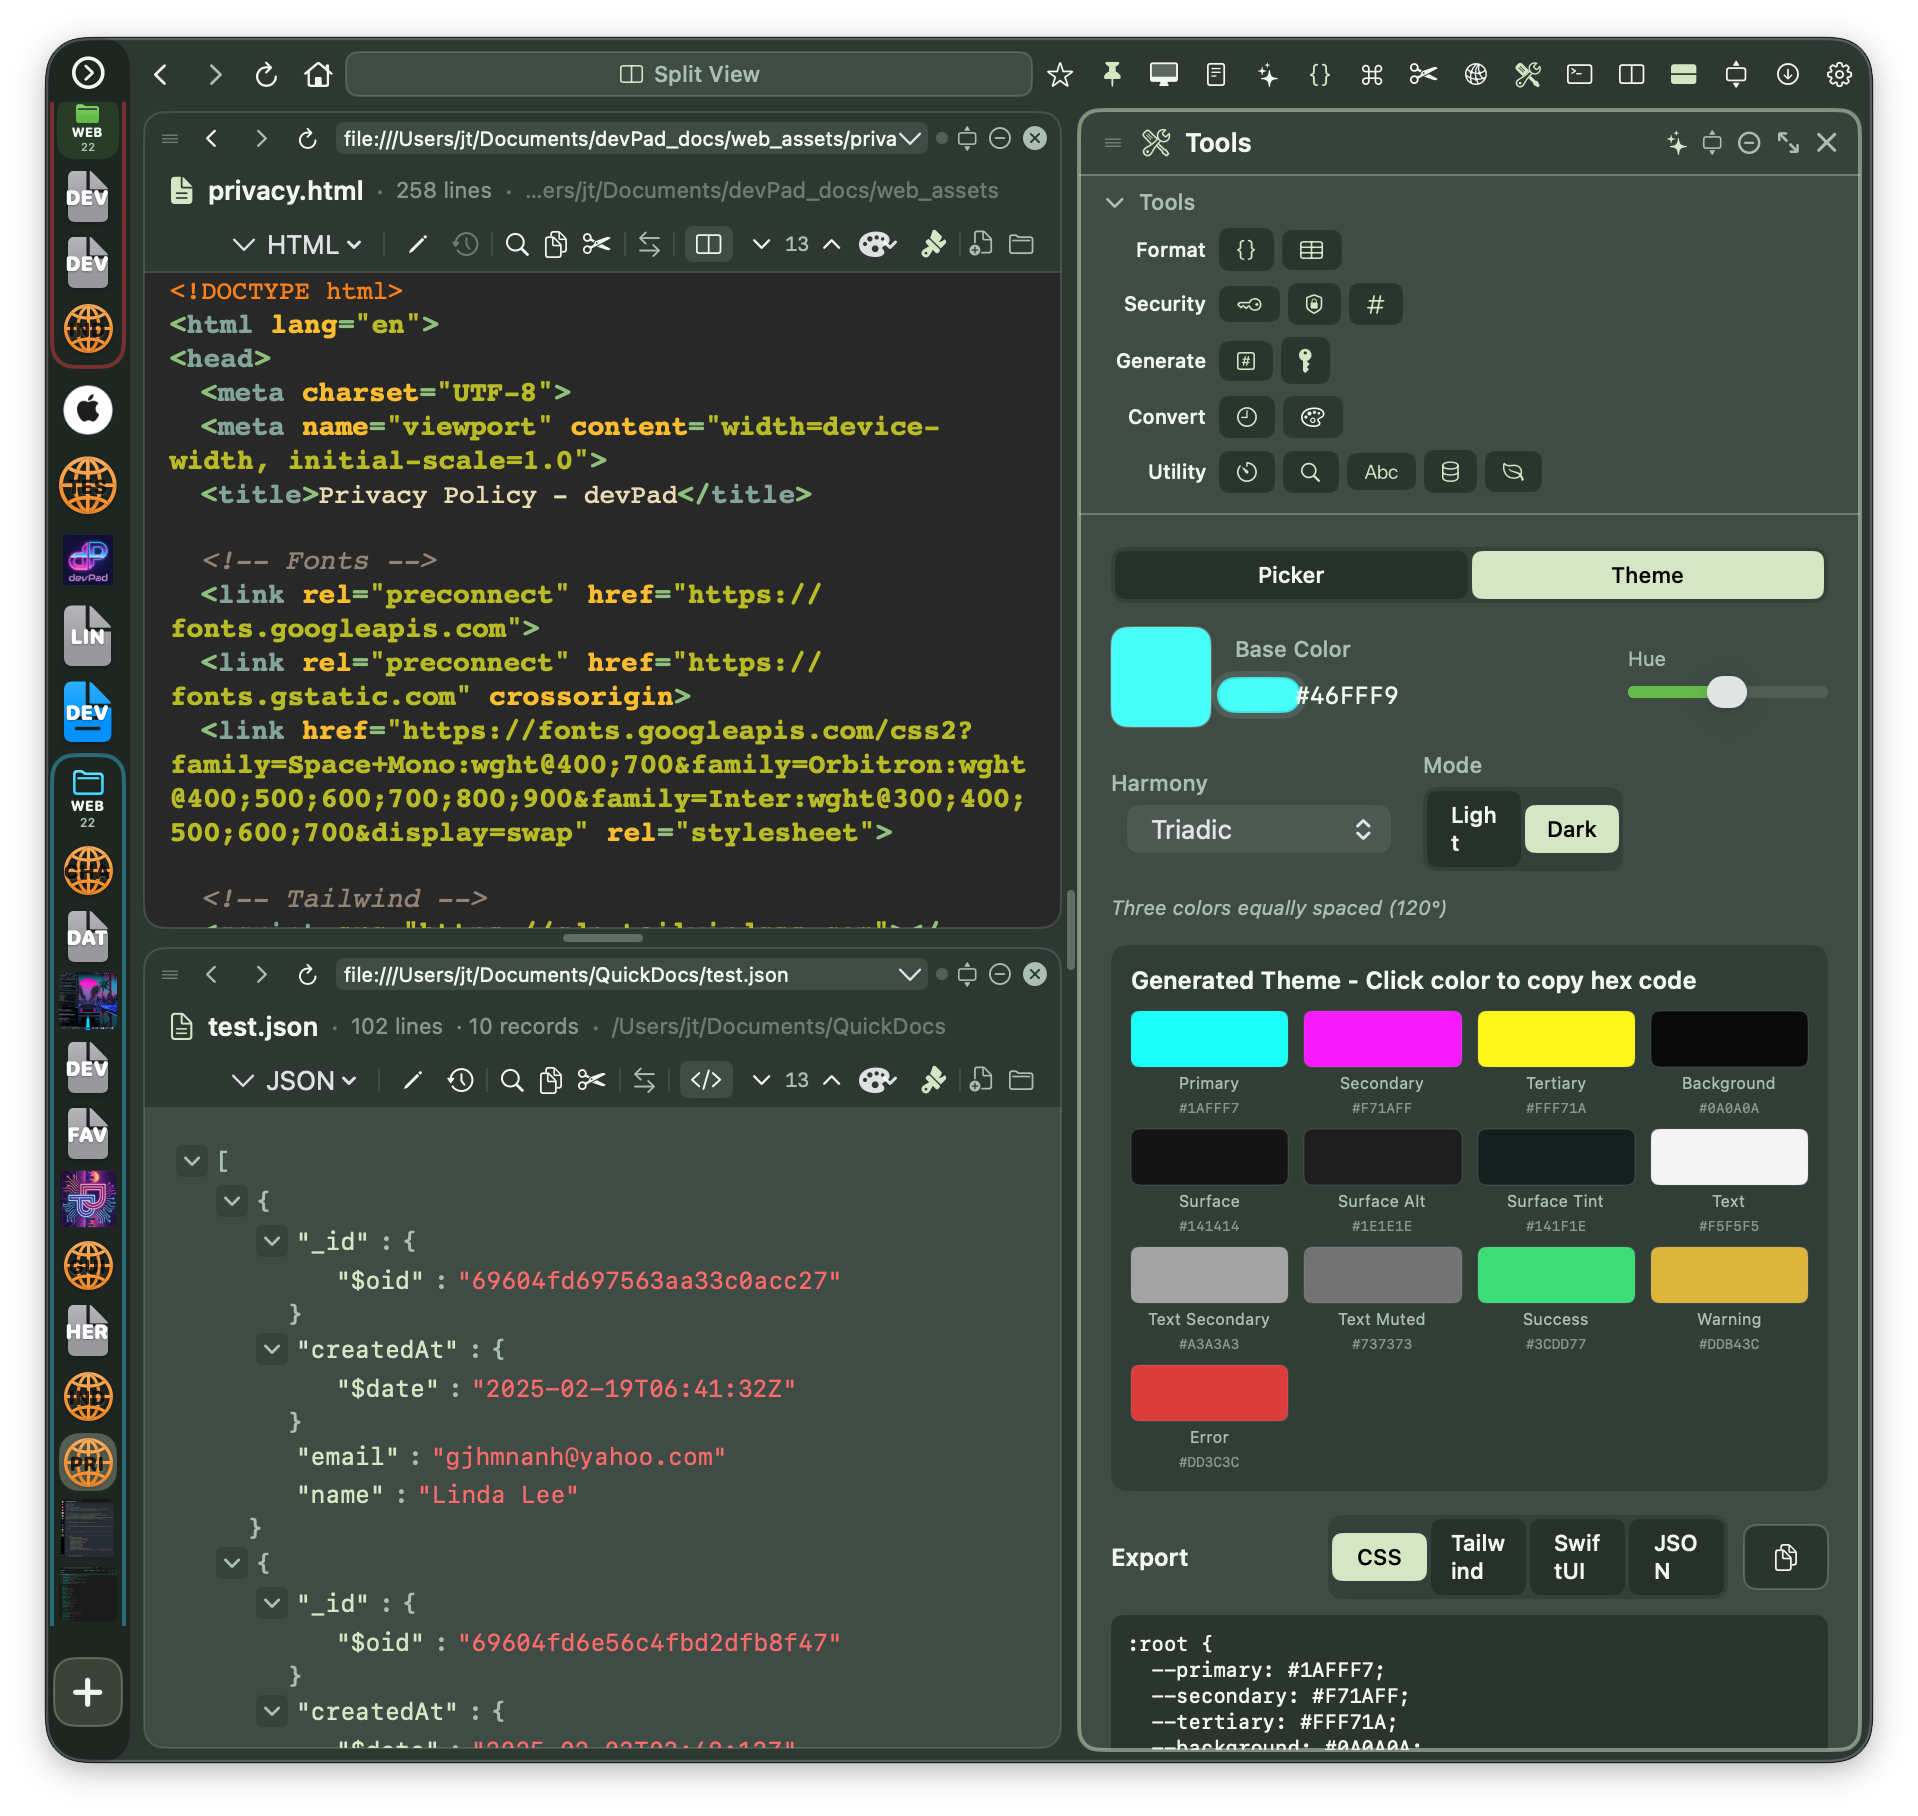
Color Picker
Visual color picker with HEX, RGB, and HSL conversion. Includes a theme generator for creating color palettes.
Regex Tester
Test regular expressions in real-time. Paste your pattern and test string - matches are highlighted instantly. Shows capture groups.
Timer
Stopwatch, countdown, and alarm modes. Useful for timing tasks or pomodoro-style work sessions.
Case Converter
Convert text between camelCase, PascalCase, snake_case, kebab-case, CONSTANT_CASE, Title Case, and more.
SQLite Browser
Open a local SQLite database file, browse tables, and run queries. Results display in a scrollable table.
MongoDB Tools
Insert statement generator, mock data generator, and schema inferencer for MongoDB.
N-Pane System
devPad's flexible layout system lets you arrange multiple tools side-by-side. You can have up to 4 panes open simultaneously.
Splitting Panes
To split the current view:
- Open the gear menu
- Select "Split View" > "Vertical Split" or "Horizontal Split"
- The pane splits, and you can load different content in each half
Tip: You can also split by clicking the split icon in individual pane headers, or by opening a tool that docks as a split pane.
Resizing Panes
Drag the divider between panes to resize. The divider highlights when you hover over it. Double-click to reset to 50/50.
Reordering Panes
Drag a pane's header to swap positions with another pane. This is useful when you want to change which side a tool appears on.
Active Pane
The active pane has a subtle glow border. When you click a bookmark or open a file, it goes to the active browser/code pane. Click a pane to make it active.
Workspaces
Save your pane arrangement for later:
- Arrange panes how you like them
- Open gear menu > "Save Current Layout"
- Give your workspace a name
- Restore anytime from gear menu > "Workspaces"
How to: Set Up a Dev Workspace
Example: Code Viewer + AI Chat + Inspector
- Open Code Viewer with a file
- Open AI Chat (splits to right)
- Open Inspector (splits below browser)
- Adjust dividers to your preference
- Save as "Dev Setup" workspace
Layout Presets
Quick layouts available from gear menu > "Layout Presets":
- Browser + Inspector - Debugging setup
- Browser + Relay - API testing setup
- Browser + Tools - Data tools alongside browsing
- Dev Setup - Full development environment
Minimizing Panes
Temporarily hide a pane without closing it:
- Click the minimize button (minus icon) in the pane's header
- The pane shrinks to a tab in the bottom tab bar
- Click the tab to restore as a floating overlay
The Minimized Tab Bar
When you minimize a pane, it appears as a tab at the bottom of your panel:
- Icon tabs - Each minimized pane shows its icon (sparkle for AI, bookmark for Snippets, etc.)
- Click to float - Click any tab to restore it as a floating overlay
- Multiple panes - Minimize several panes to keep them readily accessible
- Preserves state - AI conversations, code files, and tool data persist while minimized
Floating overlay controls:
- Drag title bar - Move the overlay
- Drag corner - Resize the overlay
- Expand button - Fill the panel (like full screen)
- Dock button - Re-add to the pane layout
- Close button - Remove from minimized state
How to: Keep AI Chat Always Accessible
- Open AI Chat pane and configure your connection
- Click the minimize button (−) in the AI Chat header
- The AI Chat tab appears in the bottom tab bar
- Whenever you need AI help, click the tab to float it over your current work
- Click the minimize button again to tuck it back into the tab bar
This keeps AI Chat one click away without taking permanent screen space!
Tip: Minimized panes don't count toward the 4-pane limit. You can dock additional tools, minimize them, and recall as needed.
Fullscreen Video
YouTube and other HTML5 video players support fullscreen playback:
- Click the fullscreen button on any video player
- The app panel automatically hides during fullscreen video
- Exit fullscreen (Escape, traffic lights, or double-click) to restore the panel
Panel Customization
devPad is highly customizable to fit your workflow and aesthetic preferences.
Panel Position
- Screen edge - Left or right side trigger
- Vertical position - Top, Center, or Bottom of screen
- Multi-monitor - Choose which display shows the panel
Panel Size
Presets available from gear menu:
- Narrow - Minimal width, good for quick lookups
- Medium - Balanced for most uses
- Wide - More room for code and tools
- Wideboy (50%) - Half screen width
- TallBoi (20%) - Narrow but full height
You can also drag the panel edge to resize freely.
Window Mode
- Docked (Slide Panel) - Traditional slide-out from screen edge
- Undocked (Free Window) - Standard window you can drag anywhere
Themes
25+ hand-crafted themes ranging from dark (Liquid Glass, Tokyo Night, Dracula) to light (Paperback, Mint Sky). Change themes instantly from the gear menu.
Gear Menu Reference
The gear menu (⚙️) in the toolbar provides quick access to all settings. Here's a complete breakdown:
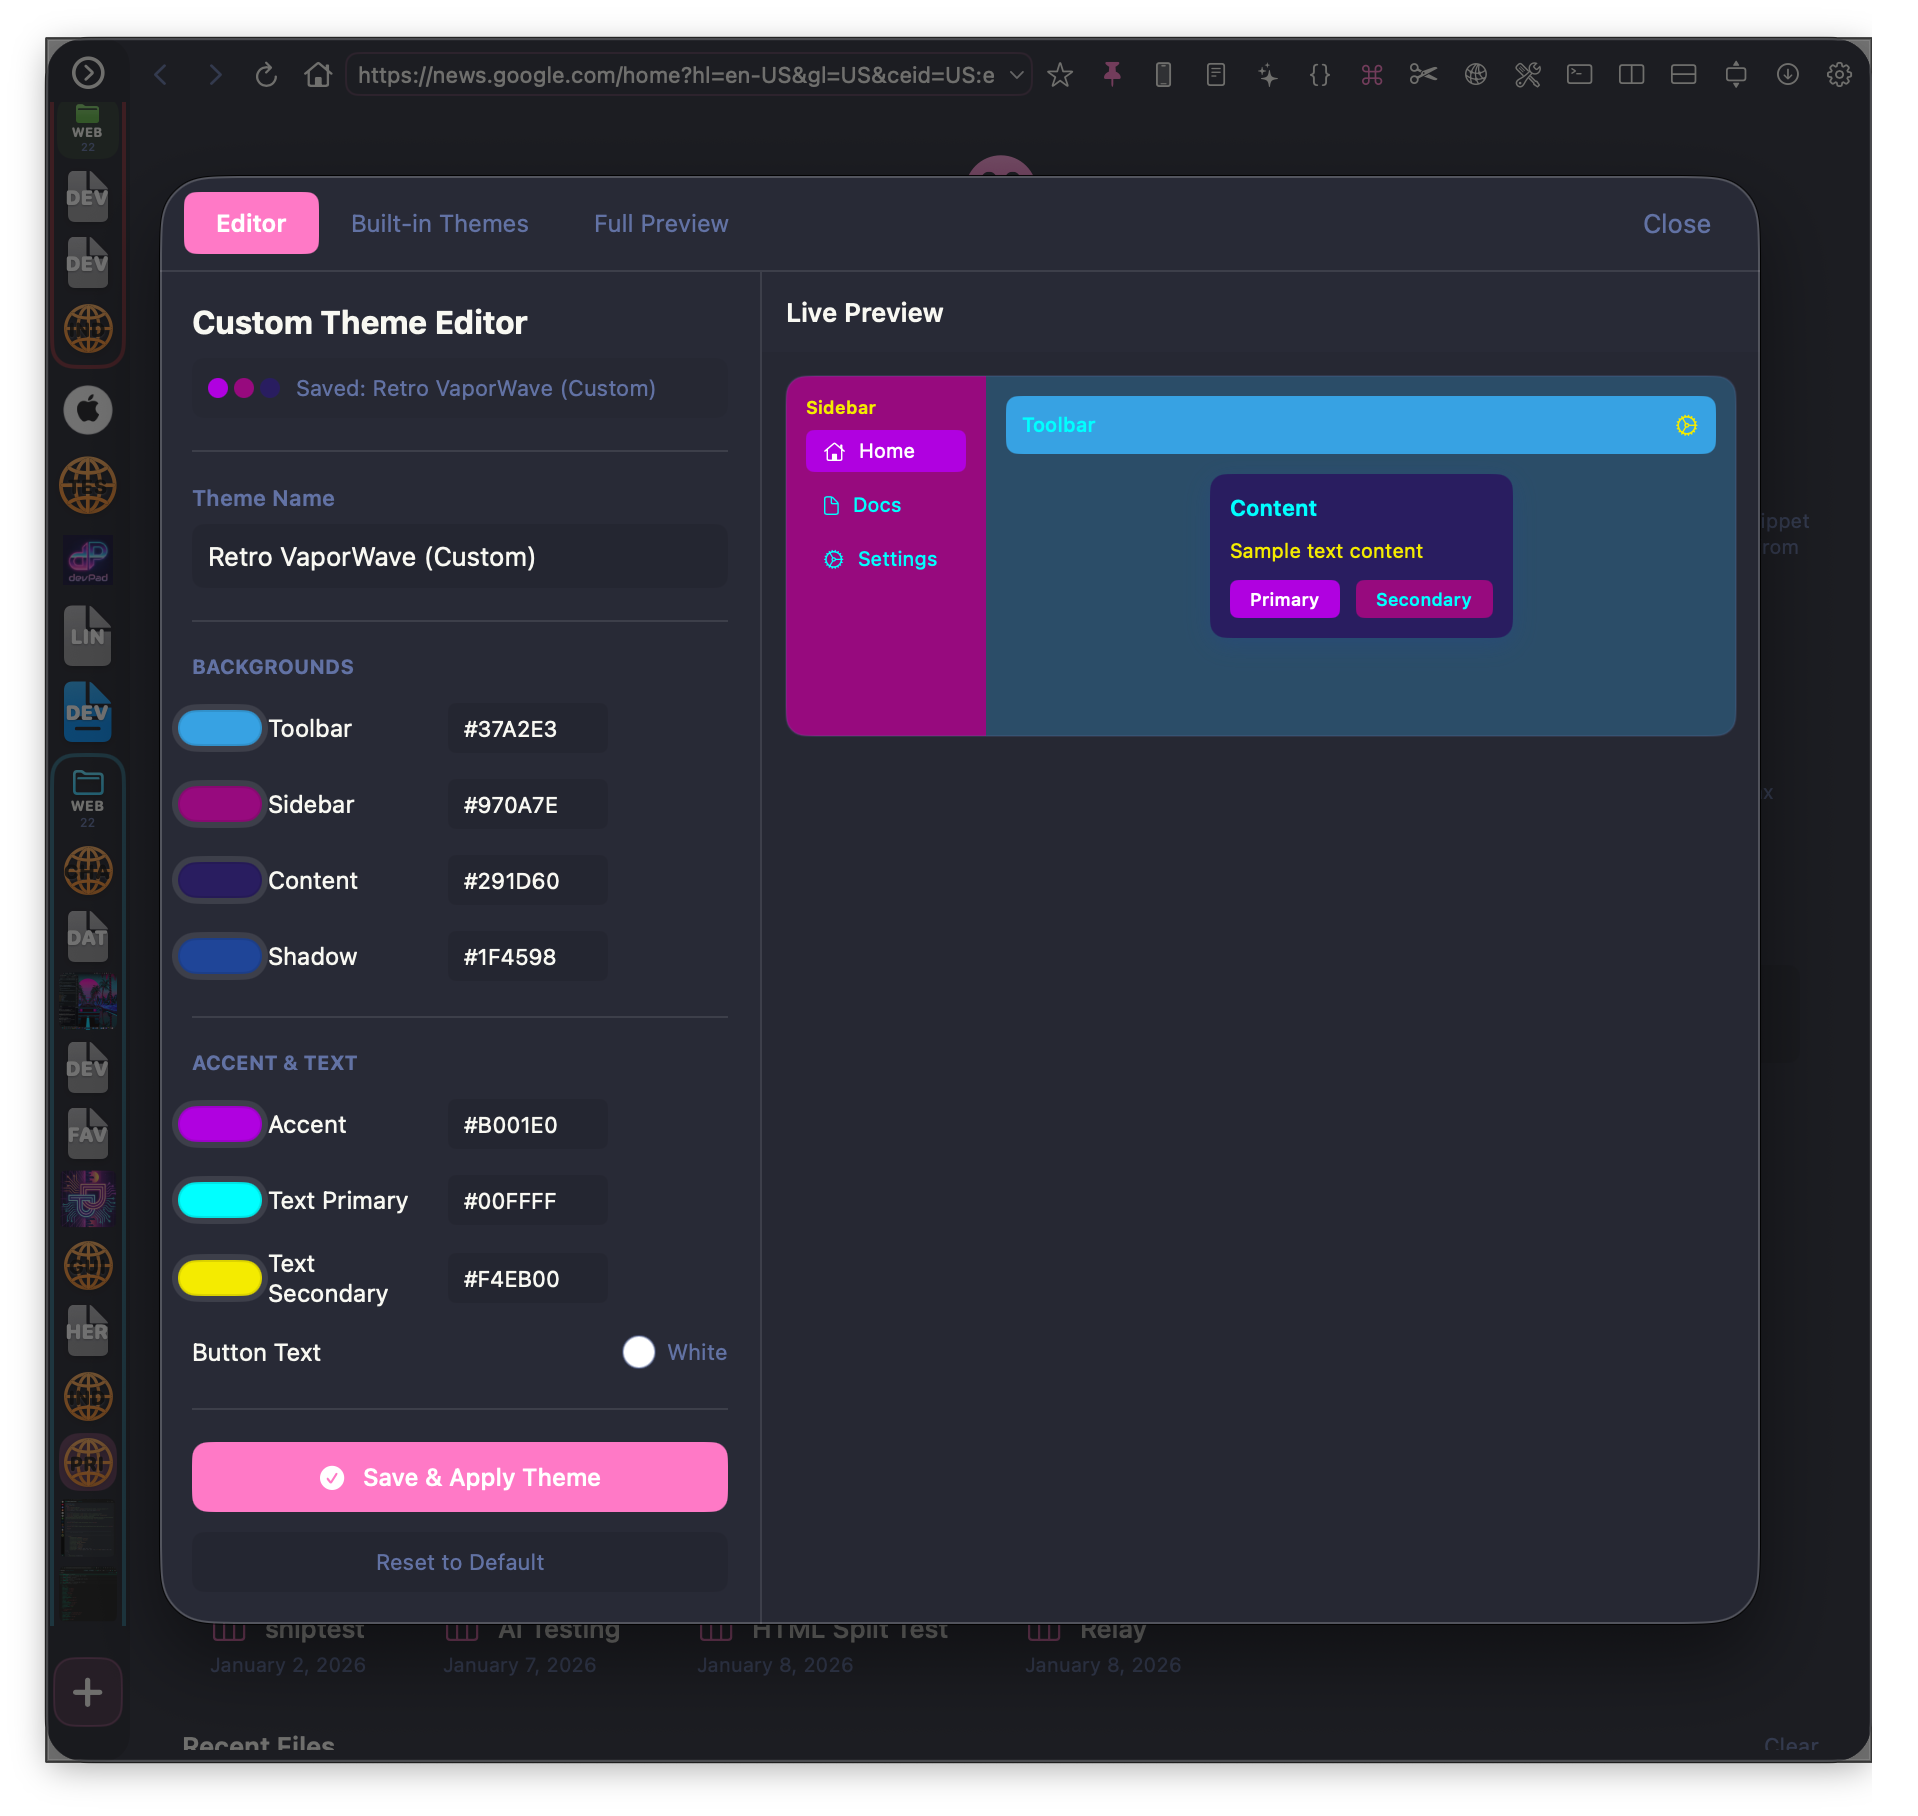
Theme Studio
Create your own custom theme with the built-in Theme Studio:
- Open gear menu > "Theme Studio"
- Start from scratch or click "Copy to Custom" on any built-in theme
- Adjust colors using the visual pickers
- See changes in real-time with the live preview
- Click "Save" to apply your custom theme
Keyboard Shortcuts
Quick reference for all keyboard shortcuts:
Global
- Cmd+Shift+. - Toggle panel visibility
- Cmd+, - Open settings
- Cmd+Shift+C - Show color picker
Browser
- Cmd+F - Find in page
- Cmd+R - Reload page
- Cmd+Shift+R - Hard reload (clear cache)
Code Viewer
- Cmd+O - Open file
- Cmd+N - New file
- Cmd+F - Search in file
- Cmd+S - Save file (in edit mode)
- Cmd++ - Increase font size
- Cmd+- - Decrease font size
Snippets & Notes
- Cmd+S - Save snippet or note
Screenshots
Code Editor with Syntax Highlighting
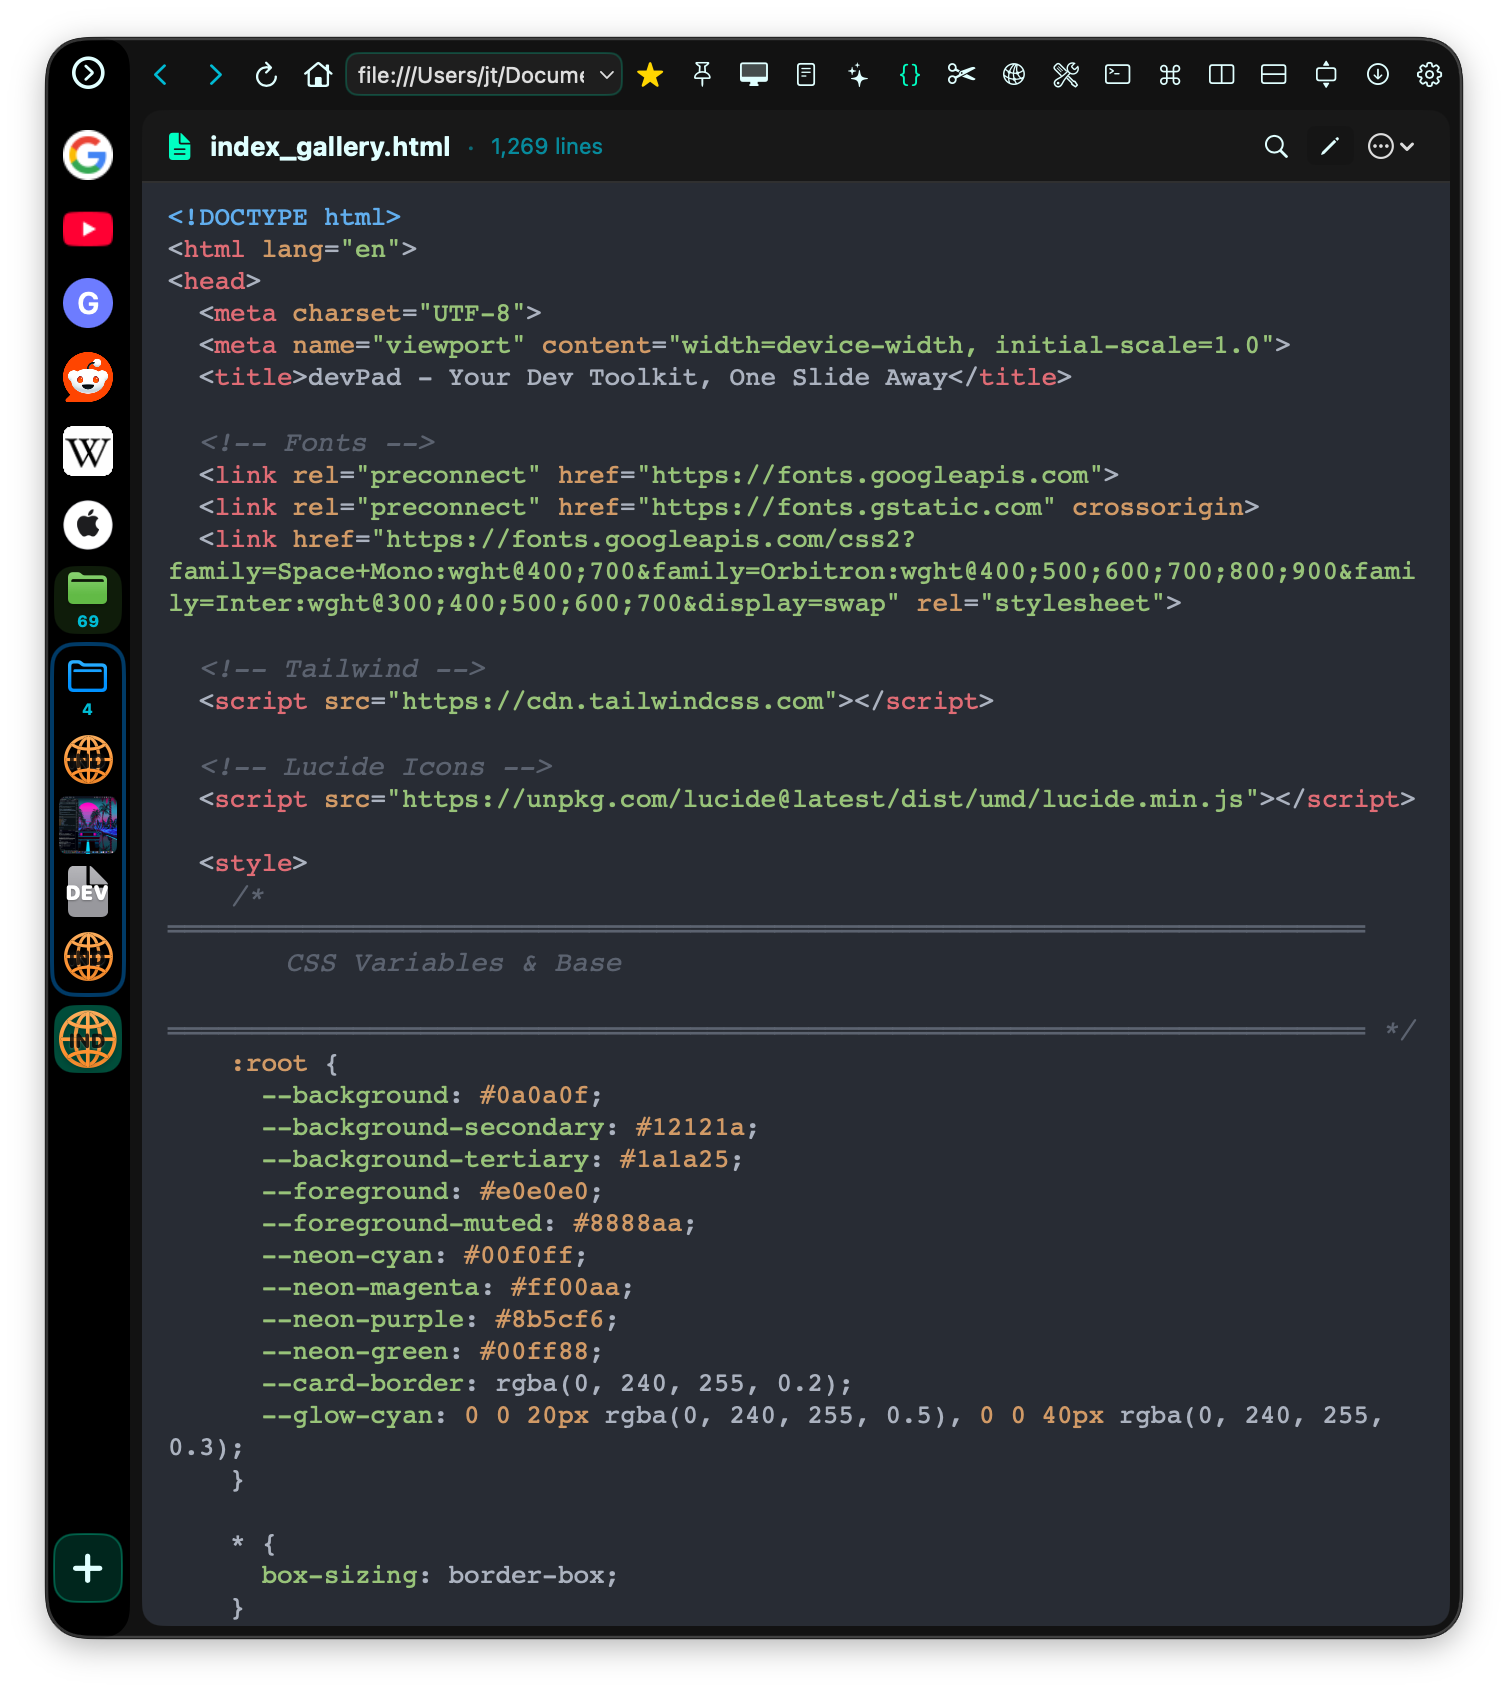
40+ language syntax highlighting with line numbers
API Client (Relay)
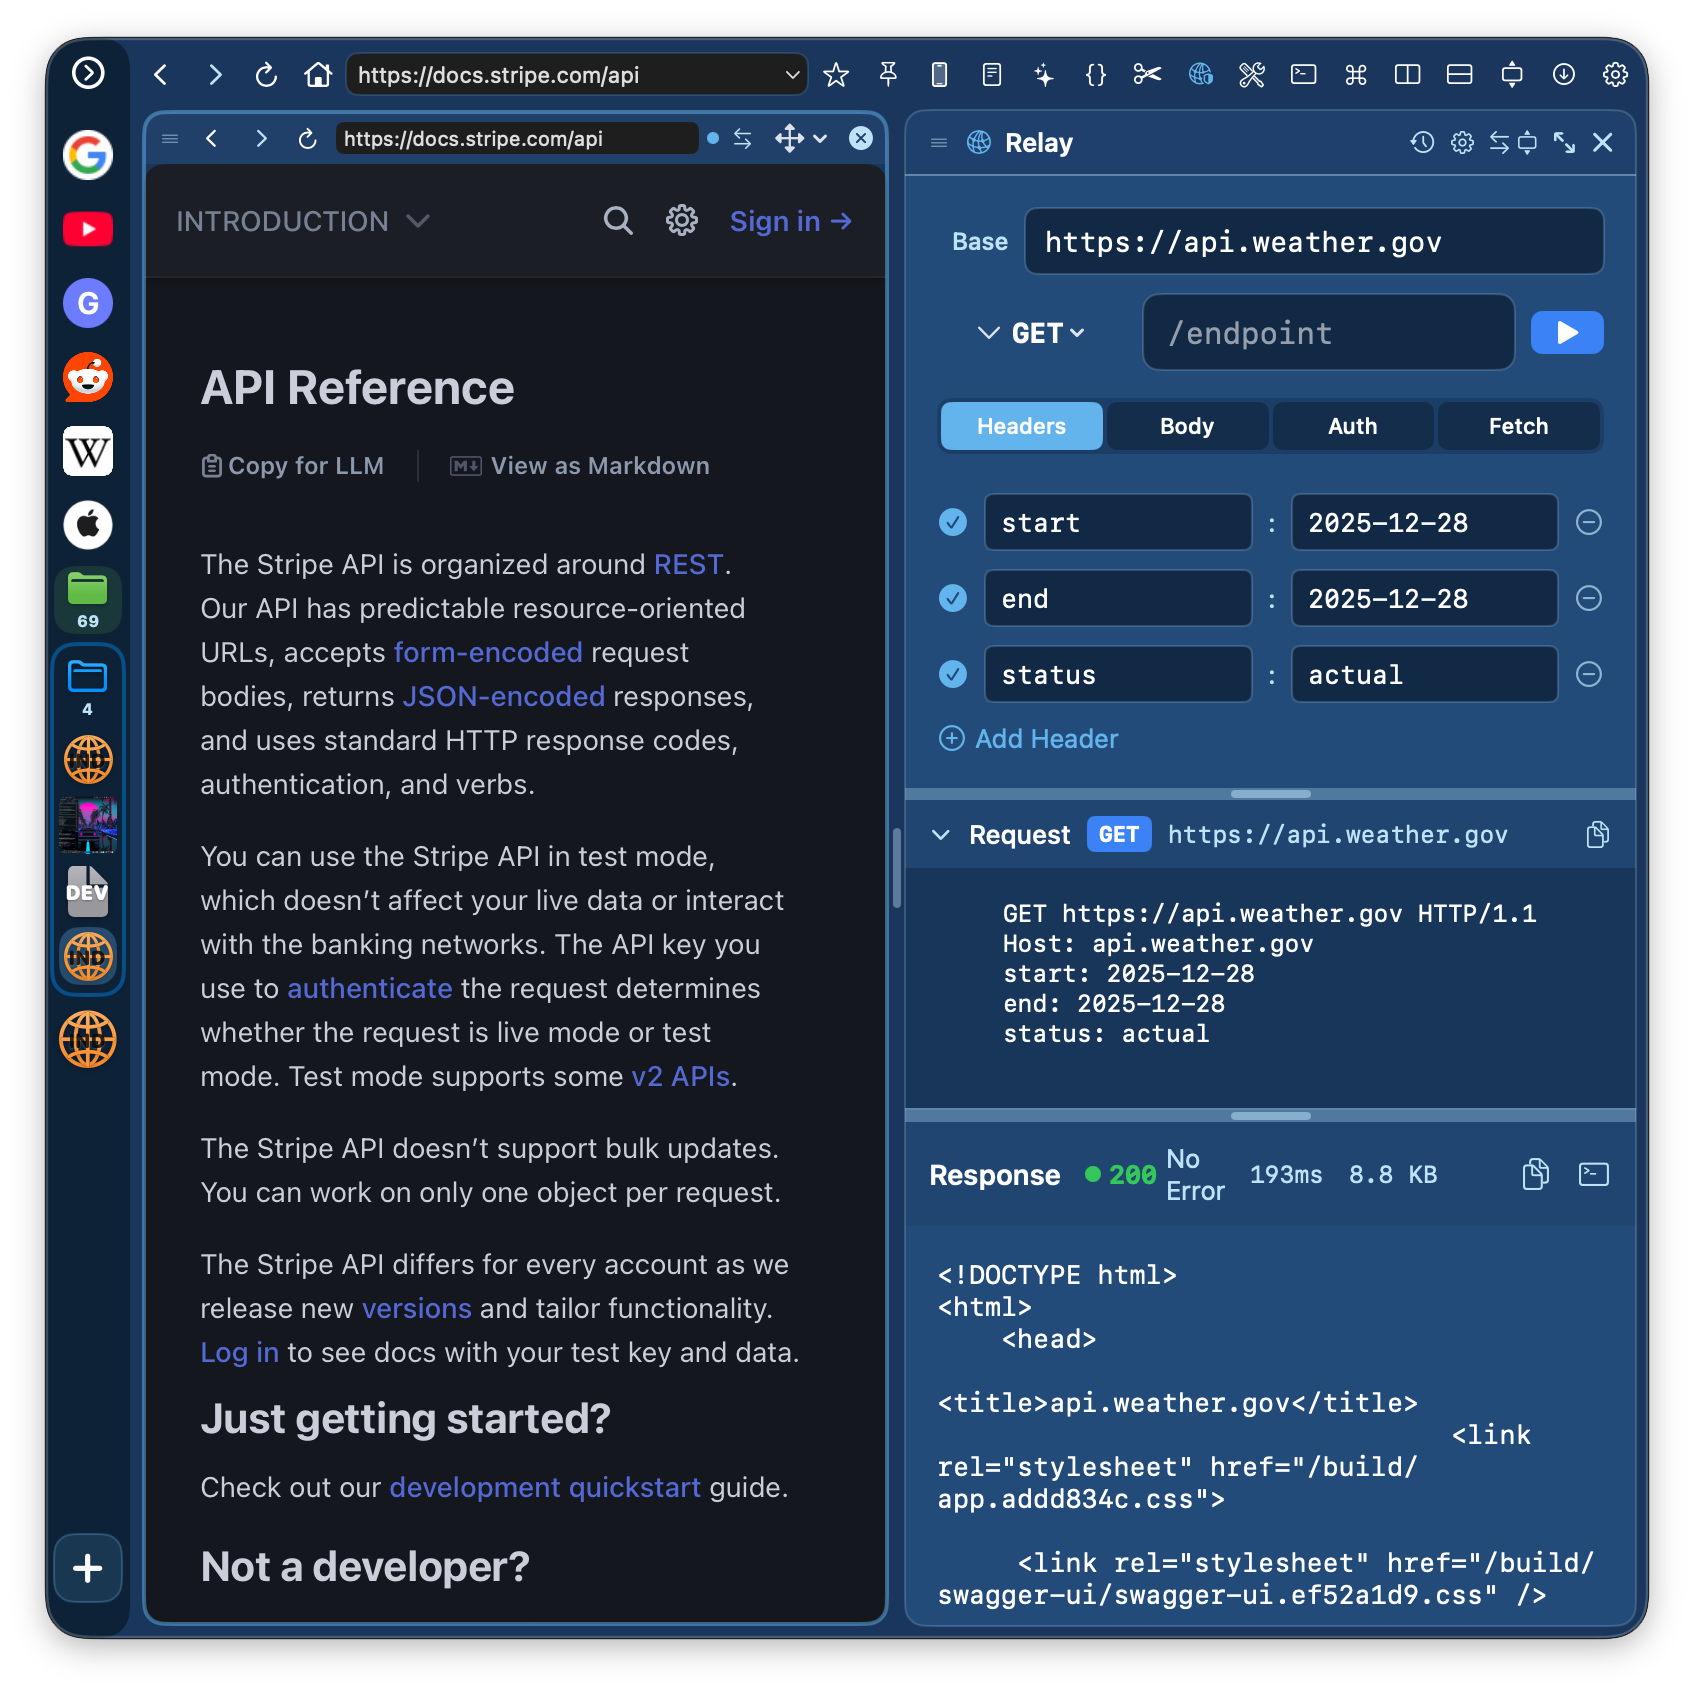
Lightweight Postman alternative with JSON tree view
Split View Panes
Drag to resize and reorder panes
AI Chat
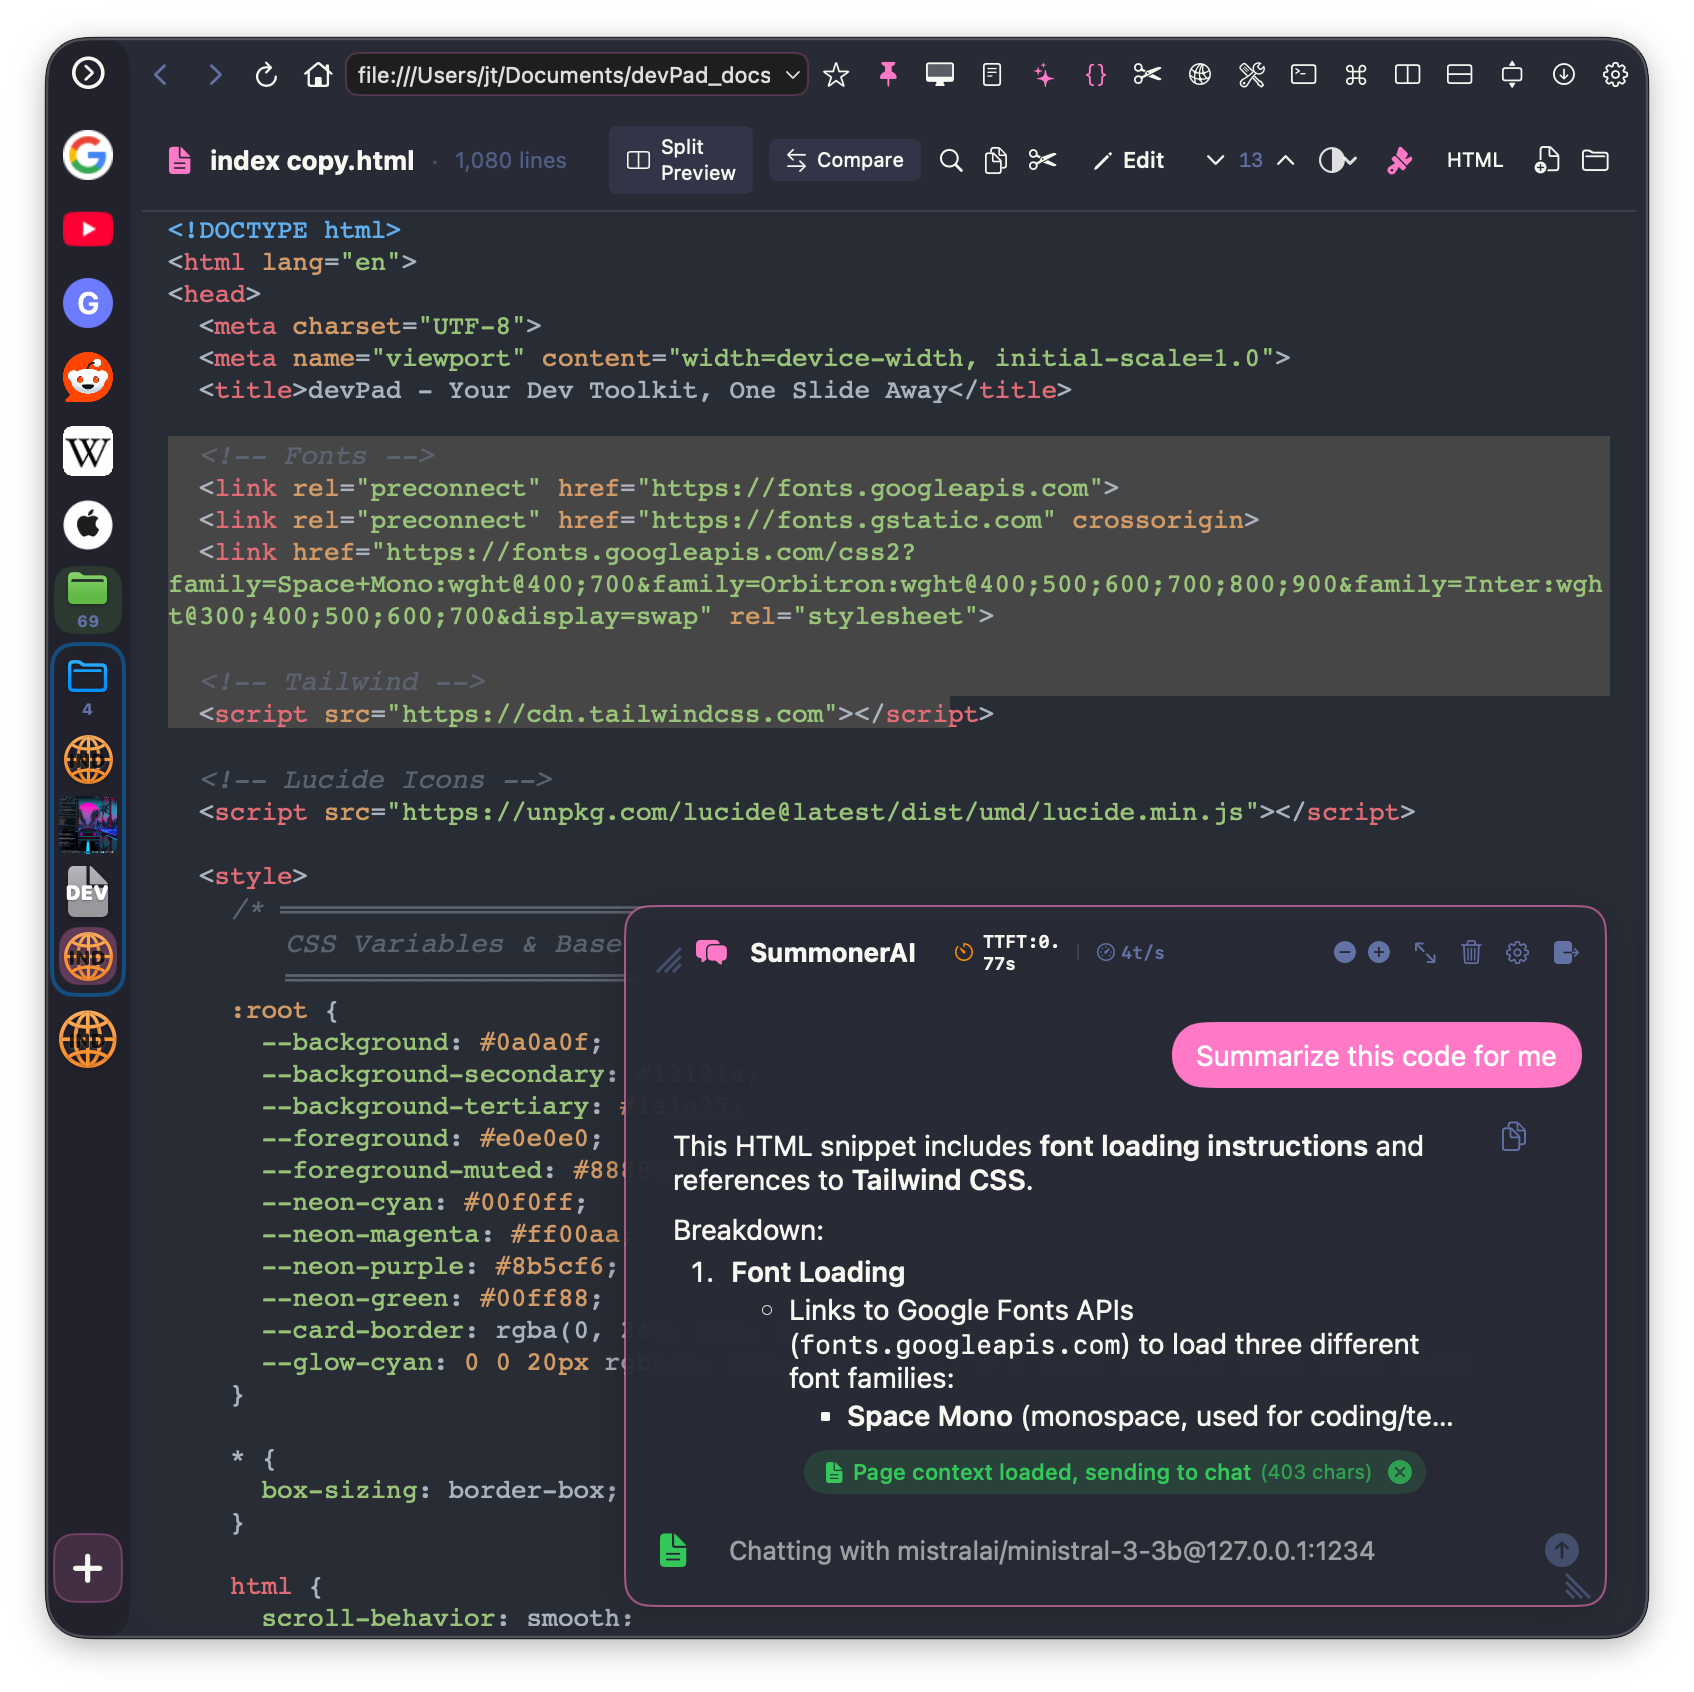
Local LLMs or cloud APIs with page context
Data Tools
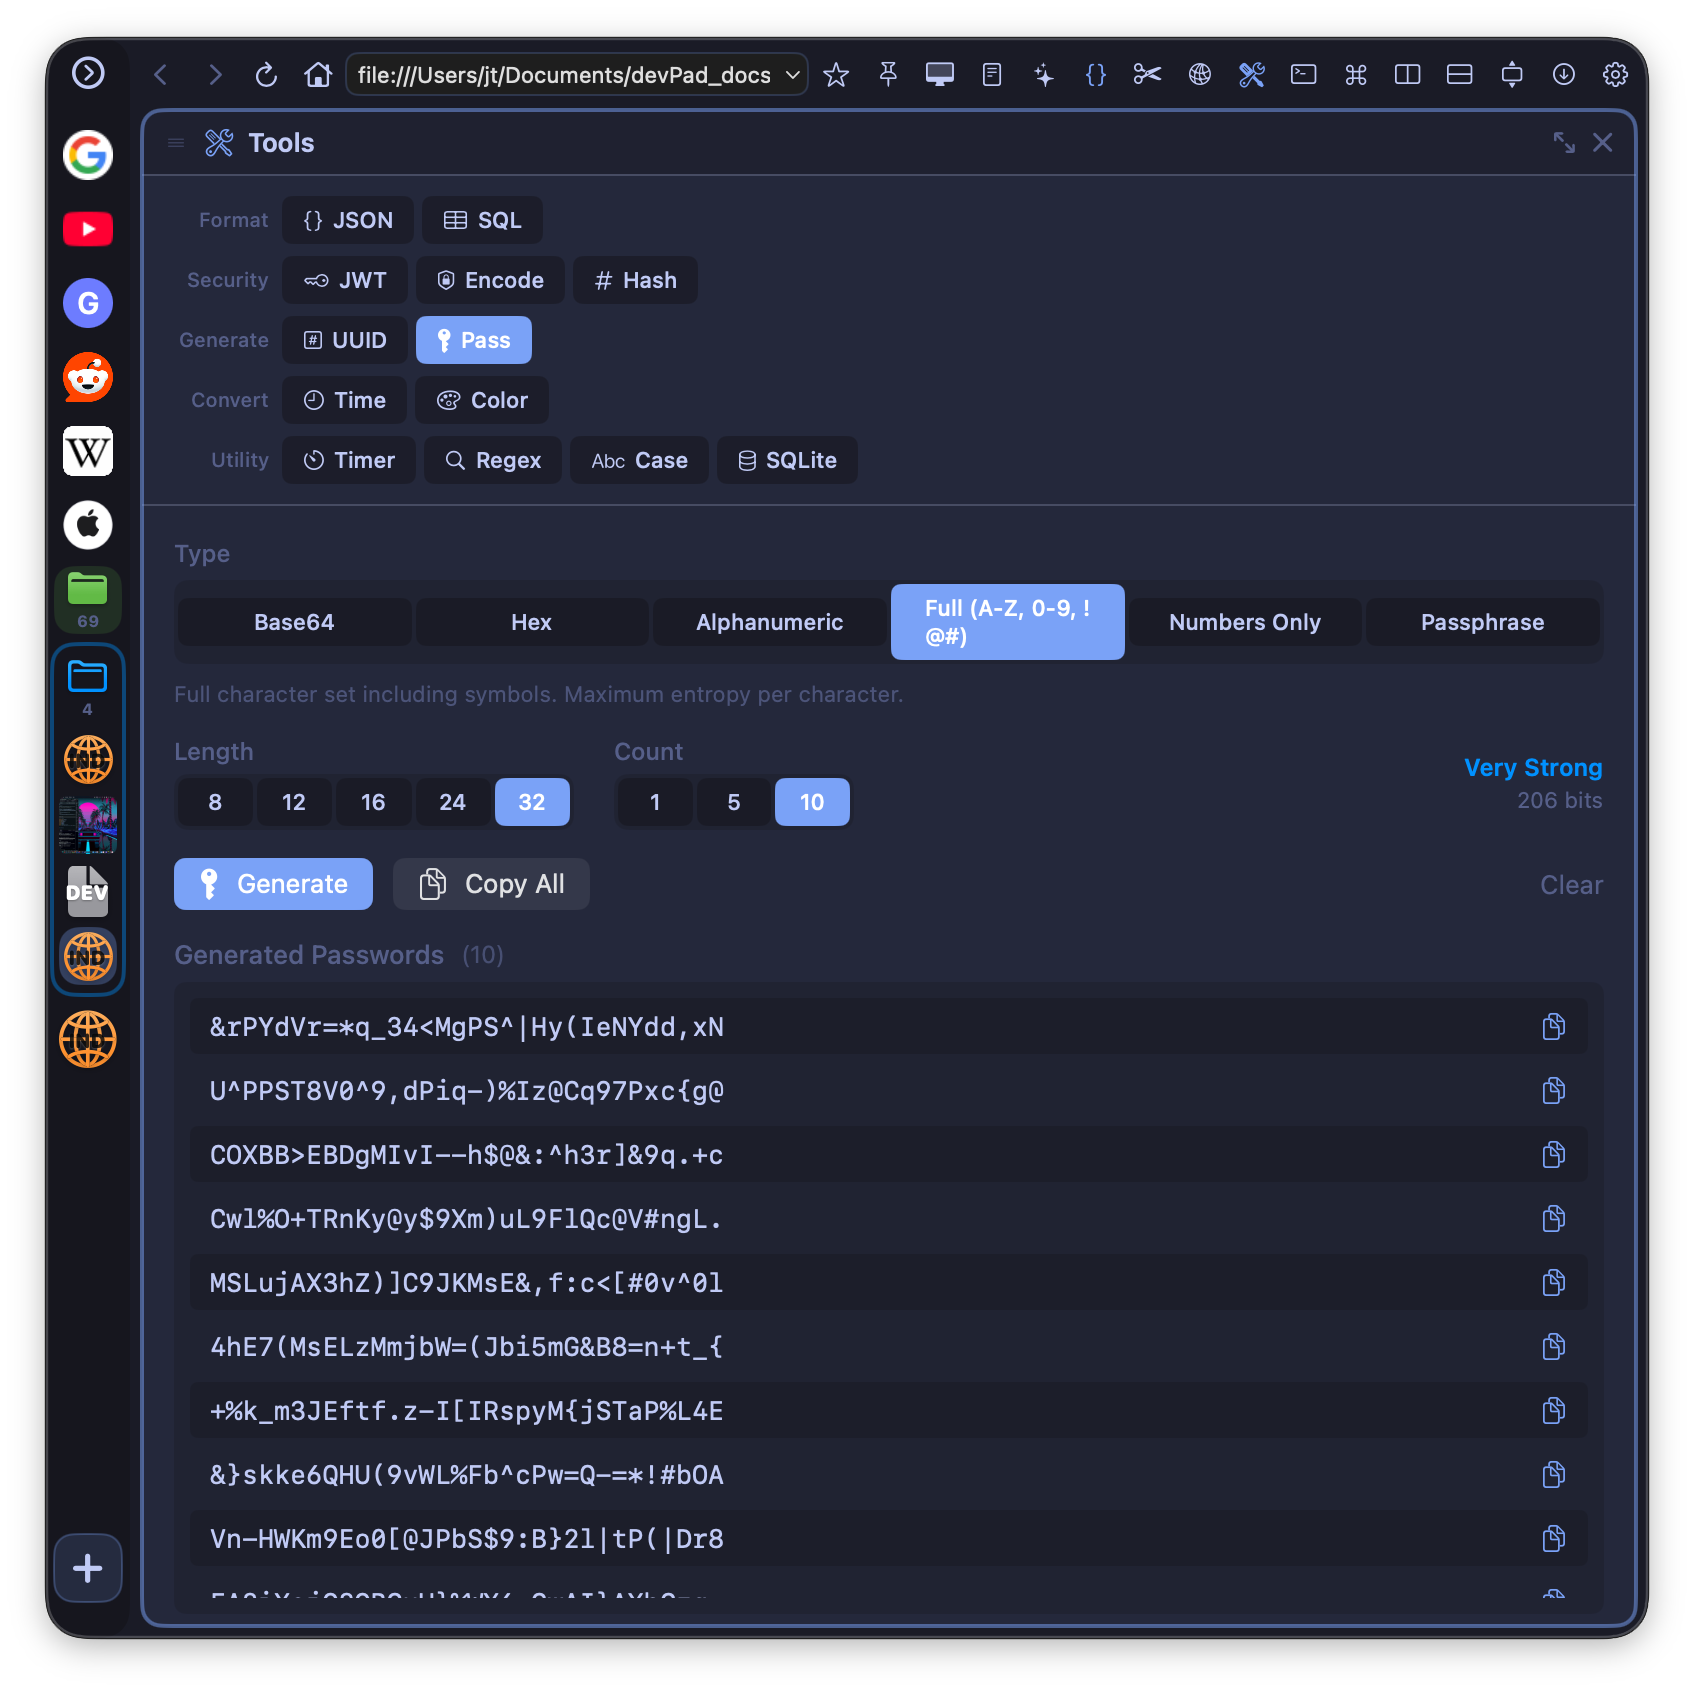
Password generator with entropy calculation
Console Inspector
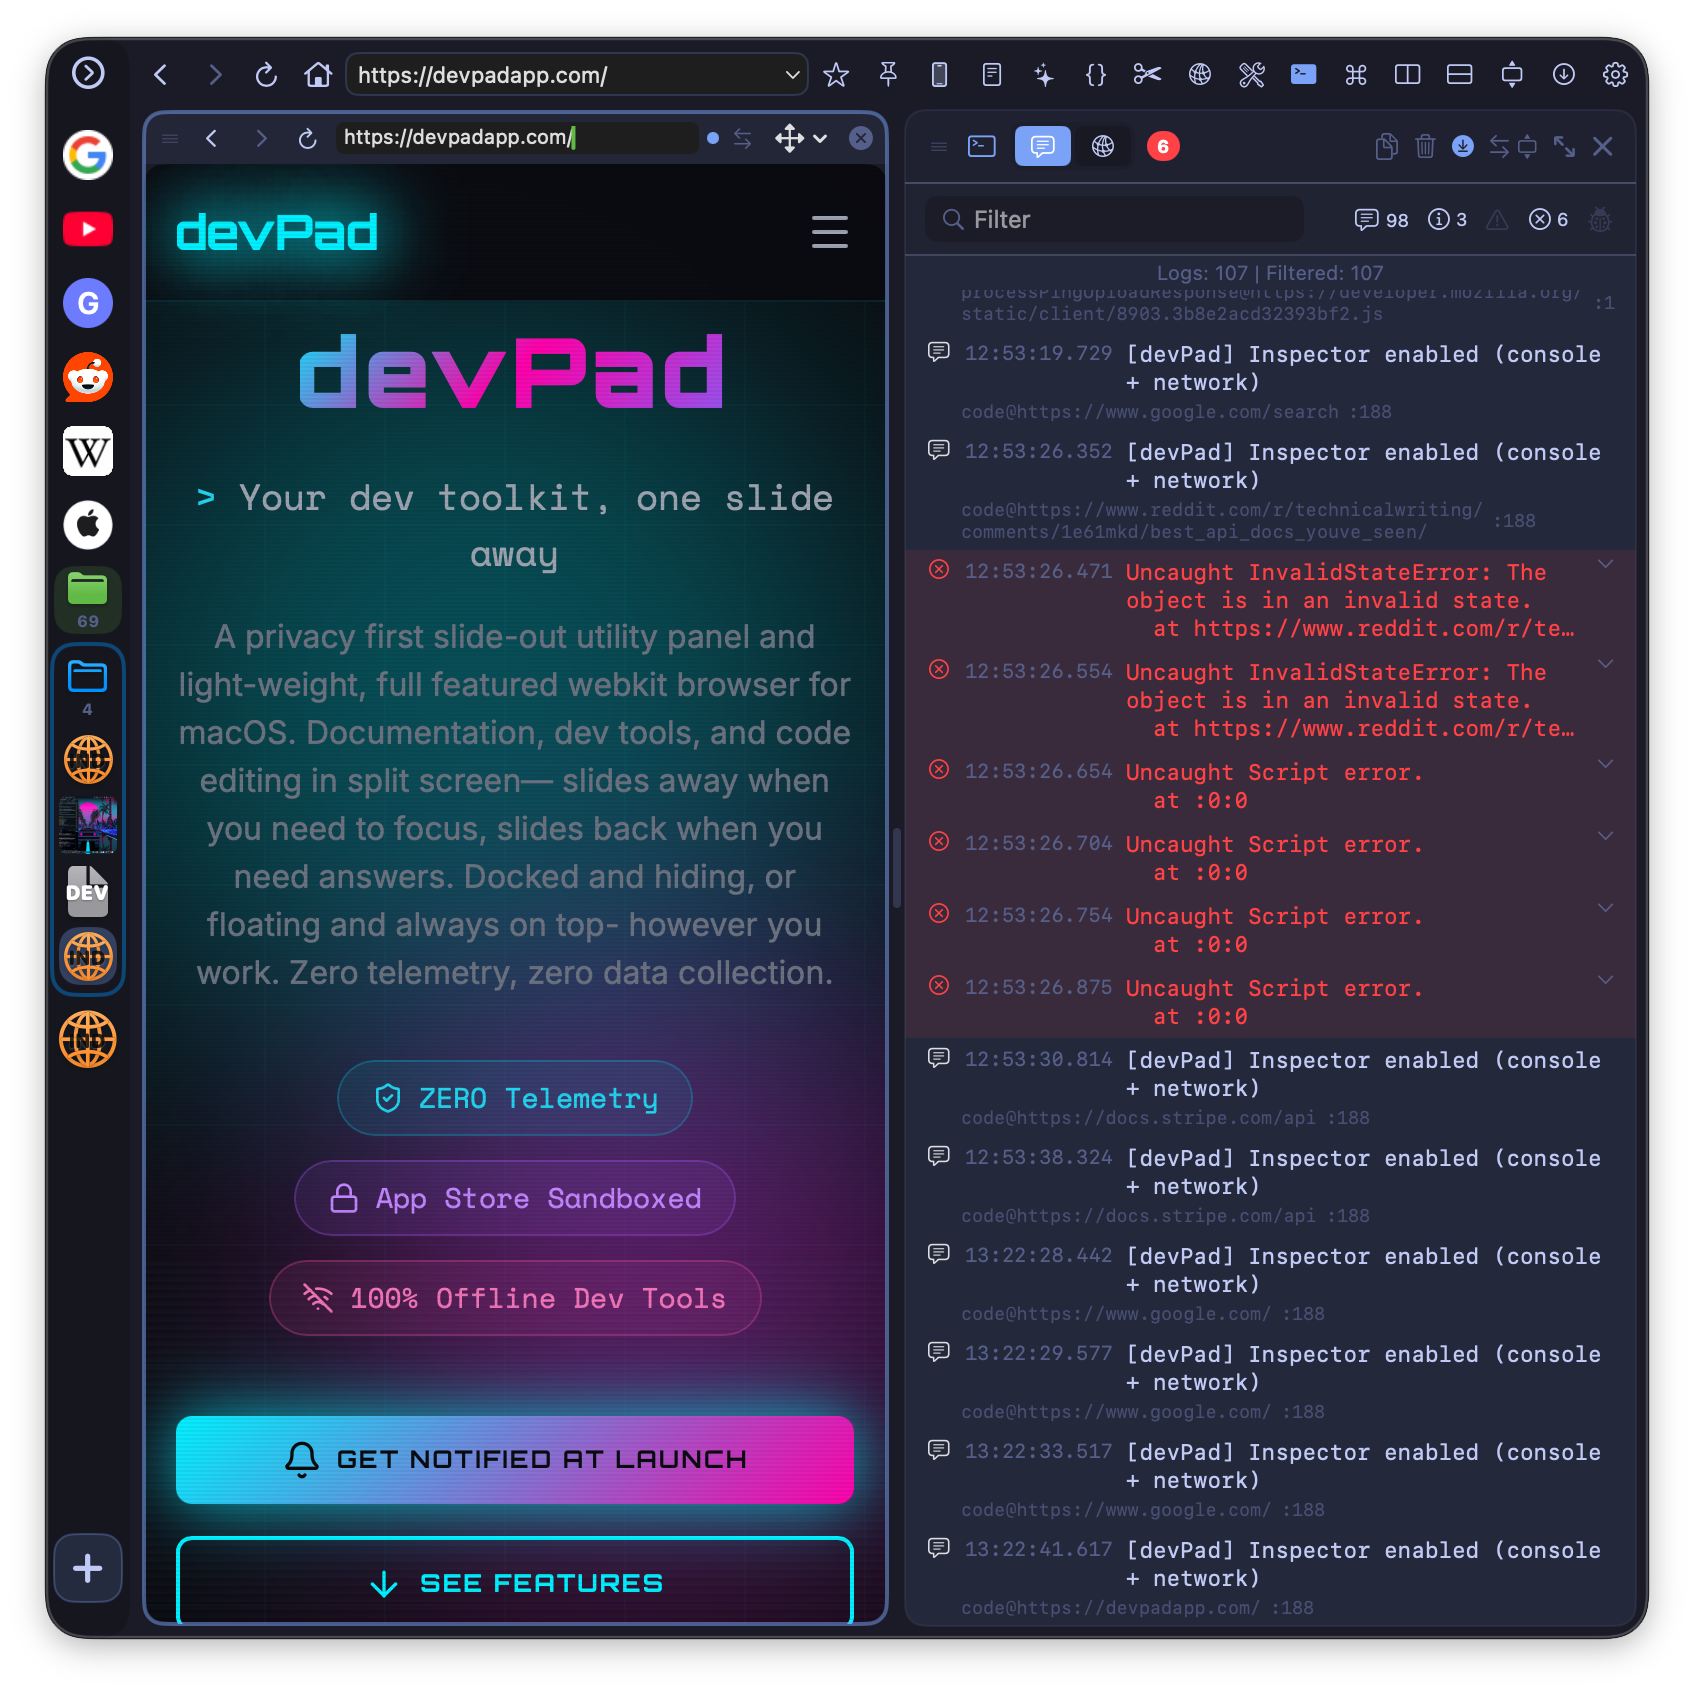
Capture console logs and network requests
SQLite Browser
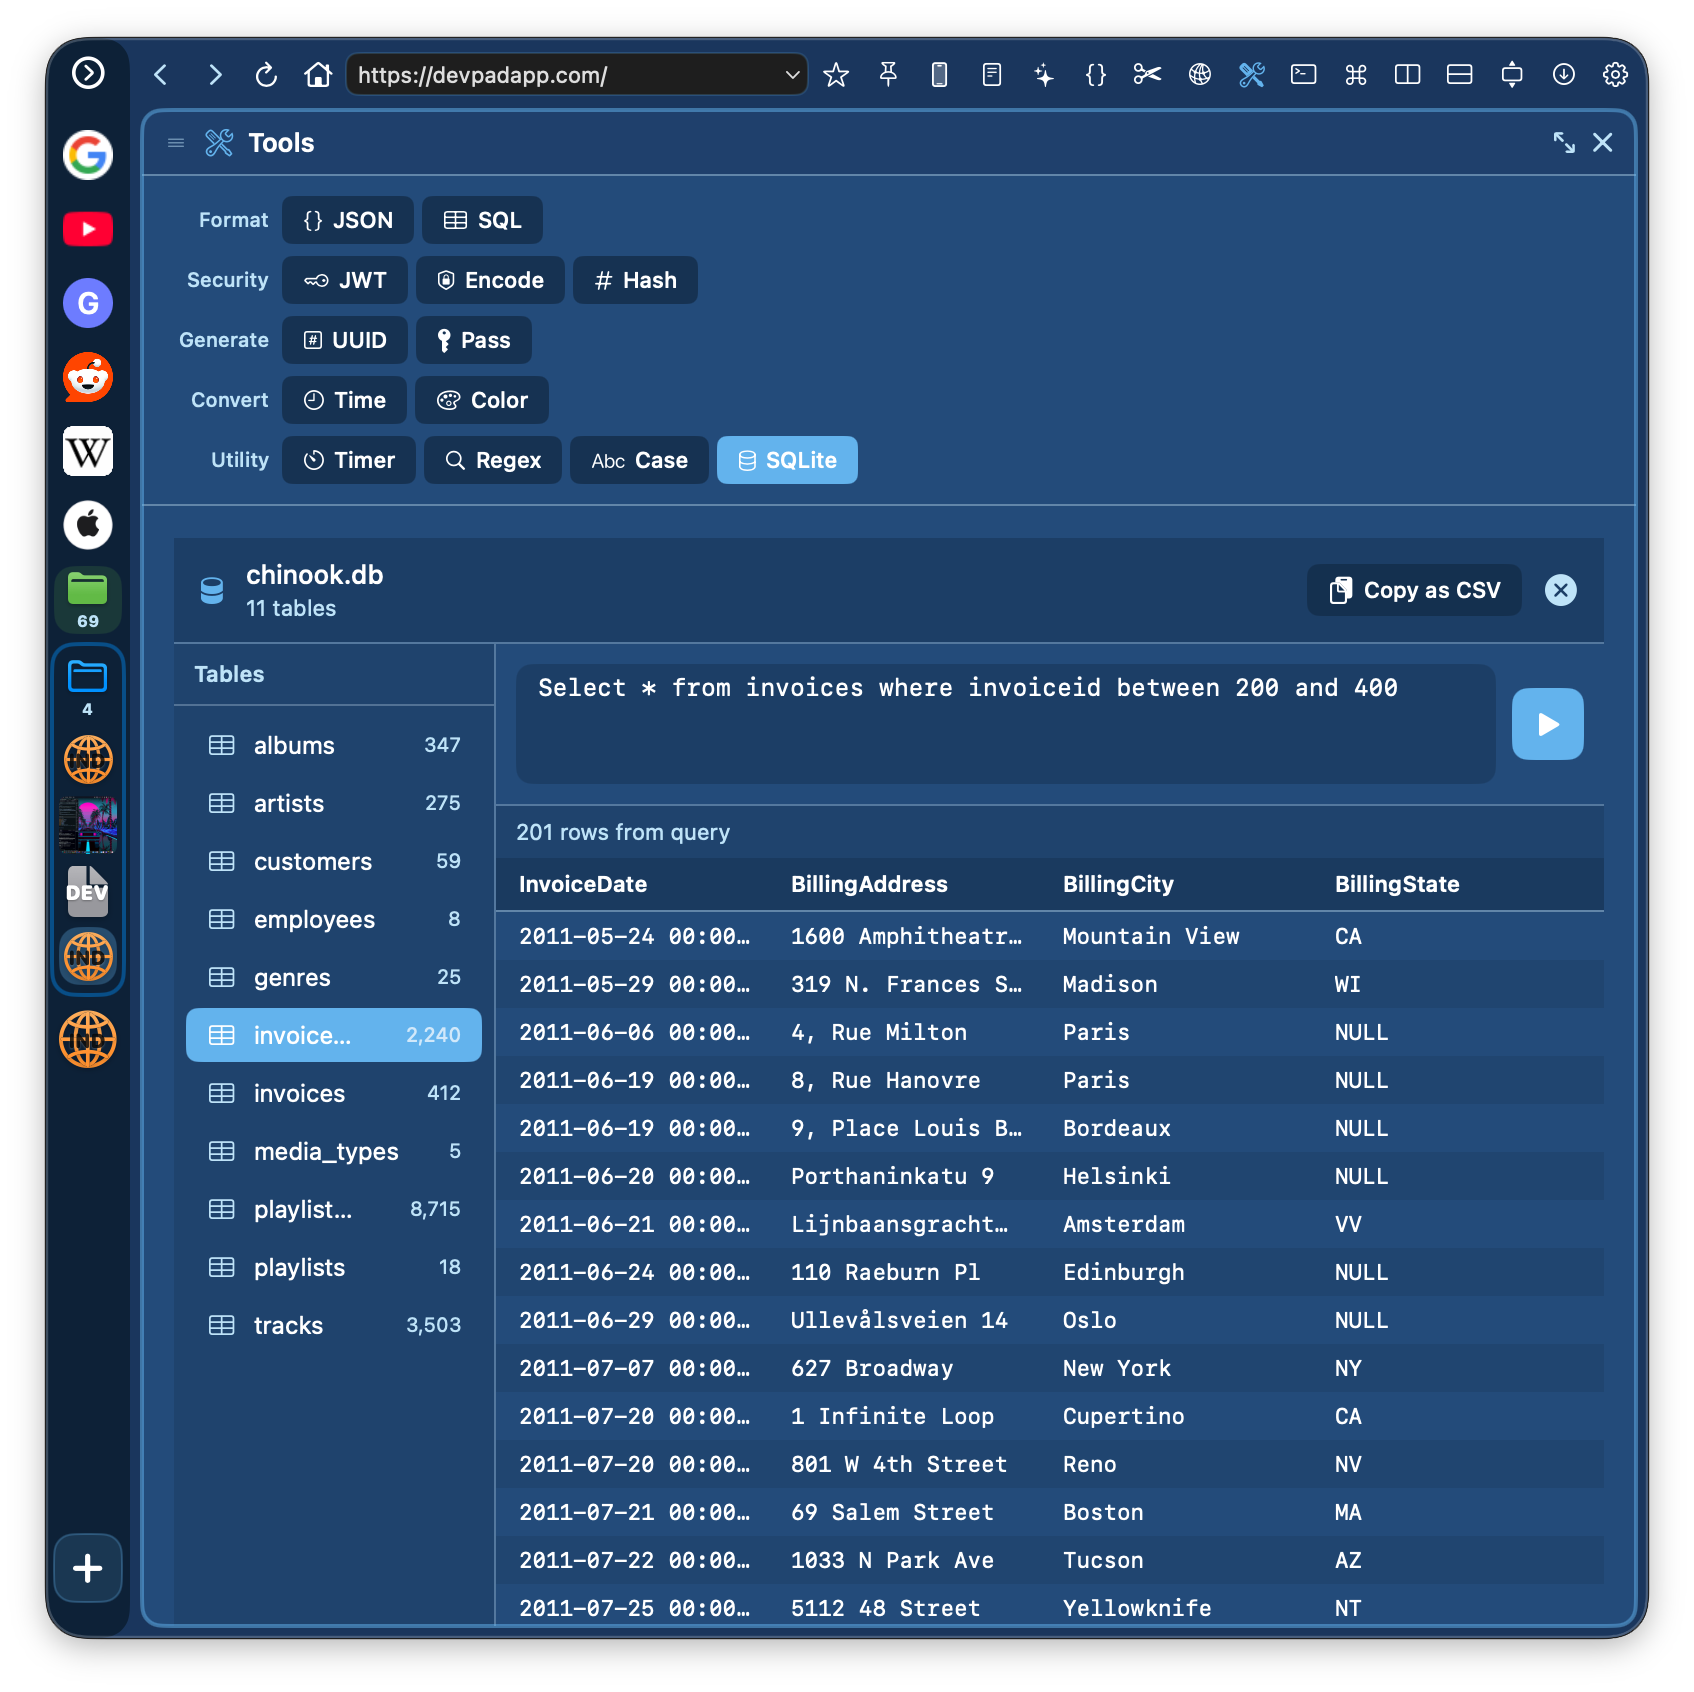
Browse and query local SQLite databases
Command Center
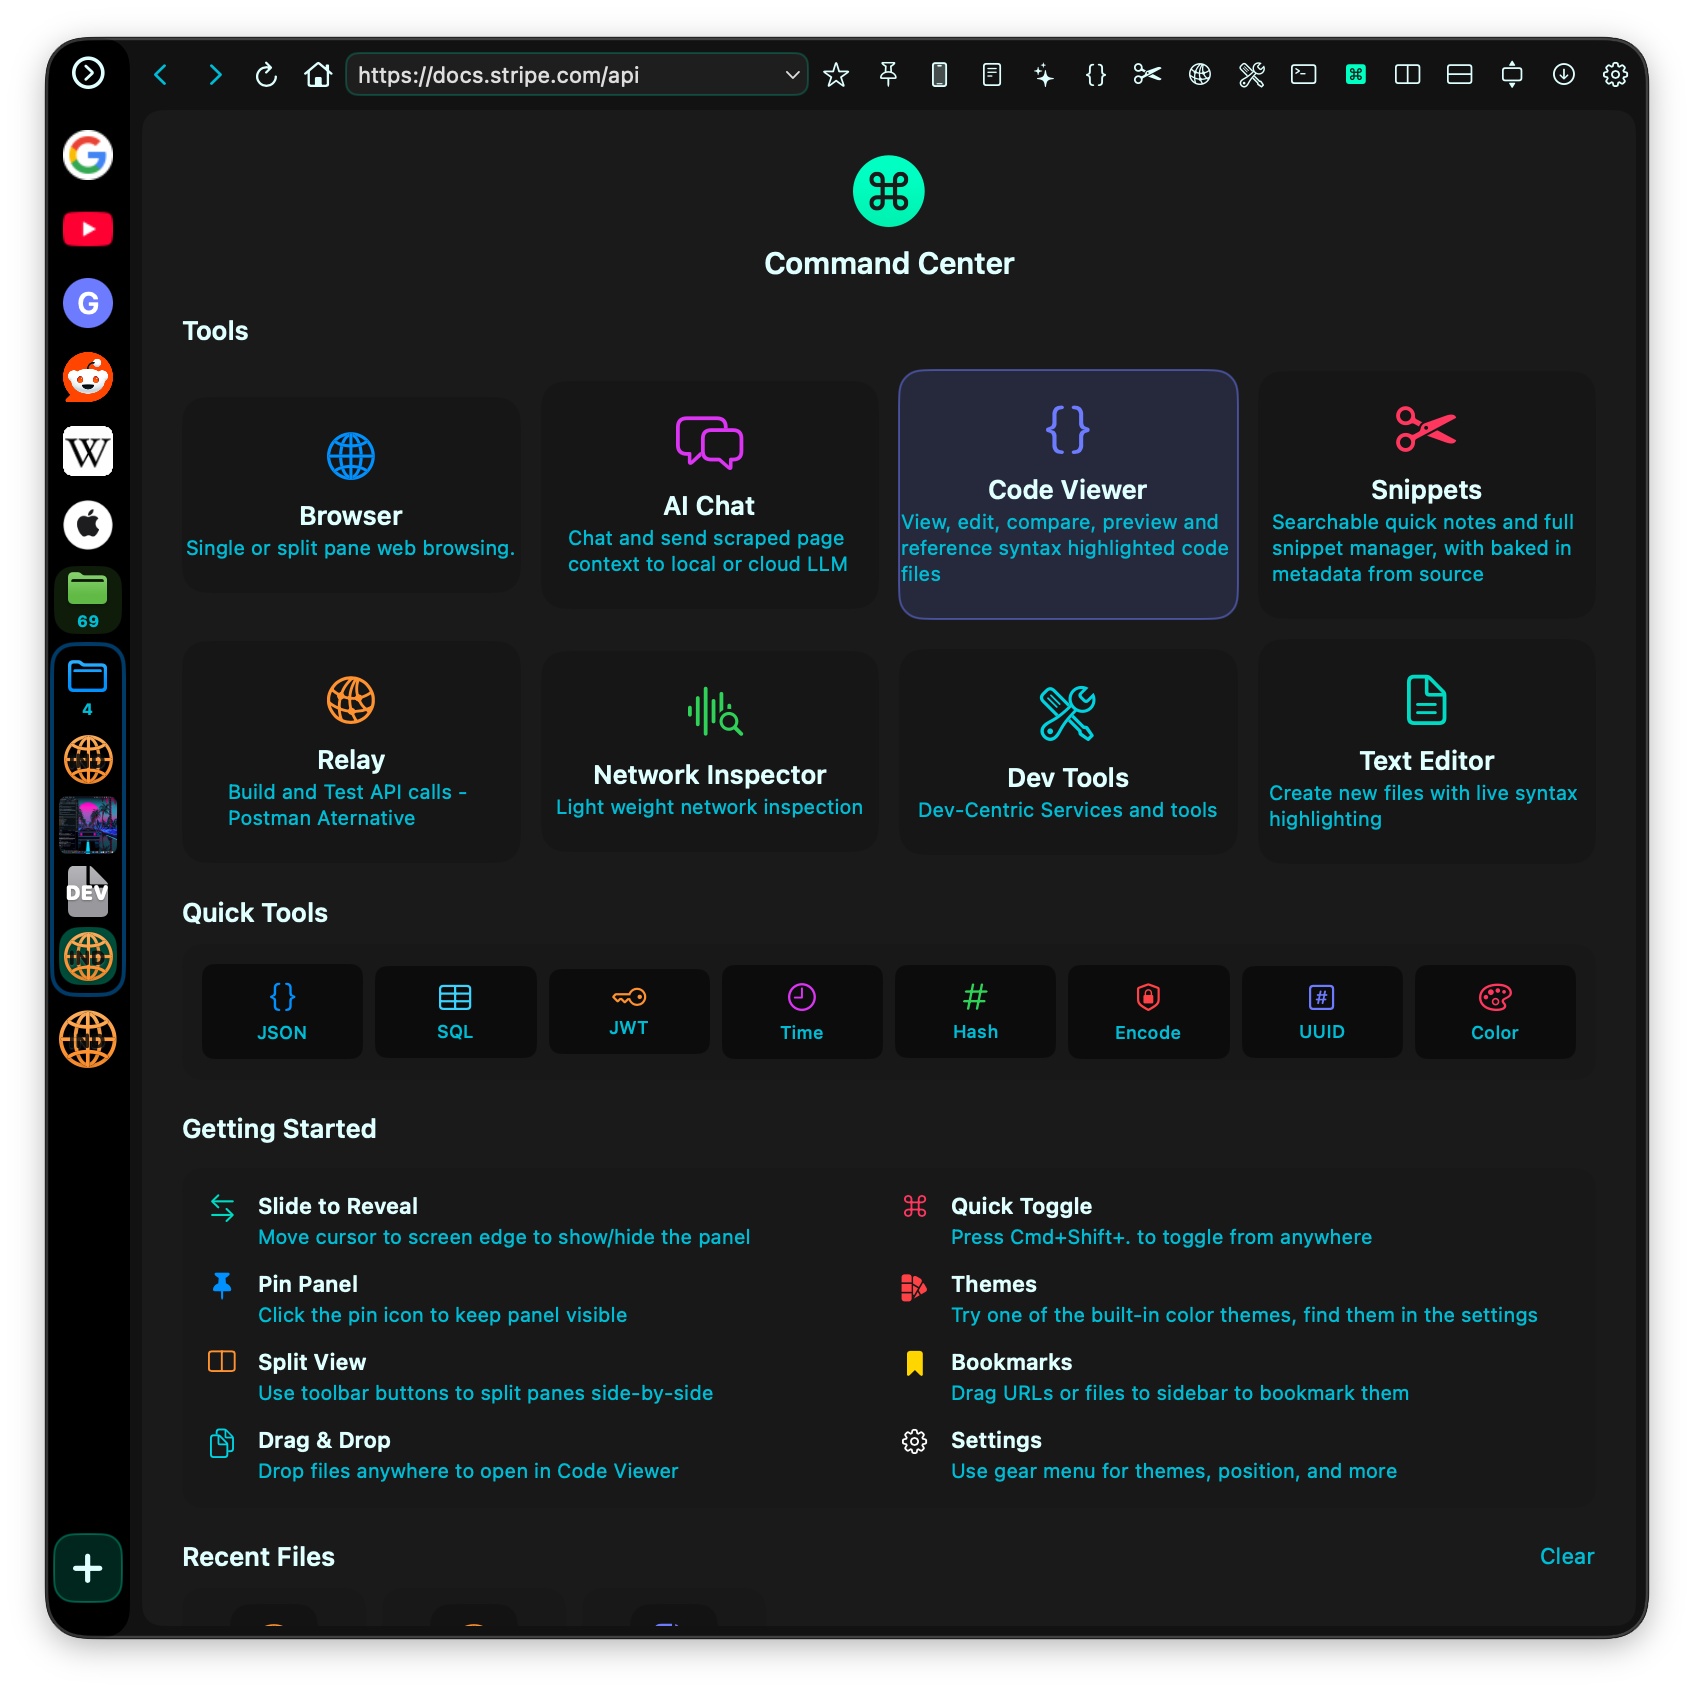
Quick access to tools, workspaces, and recent files
Code Viewer Launch Page
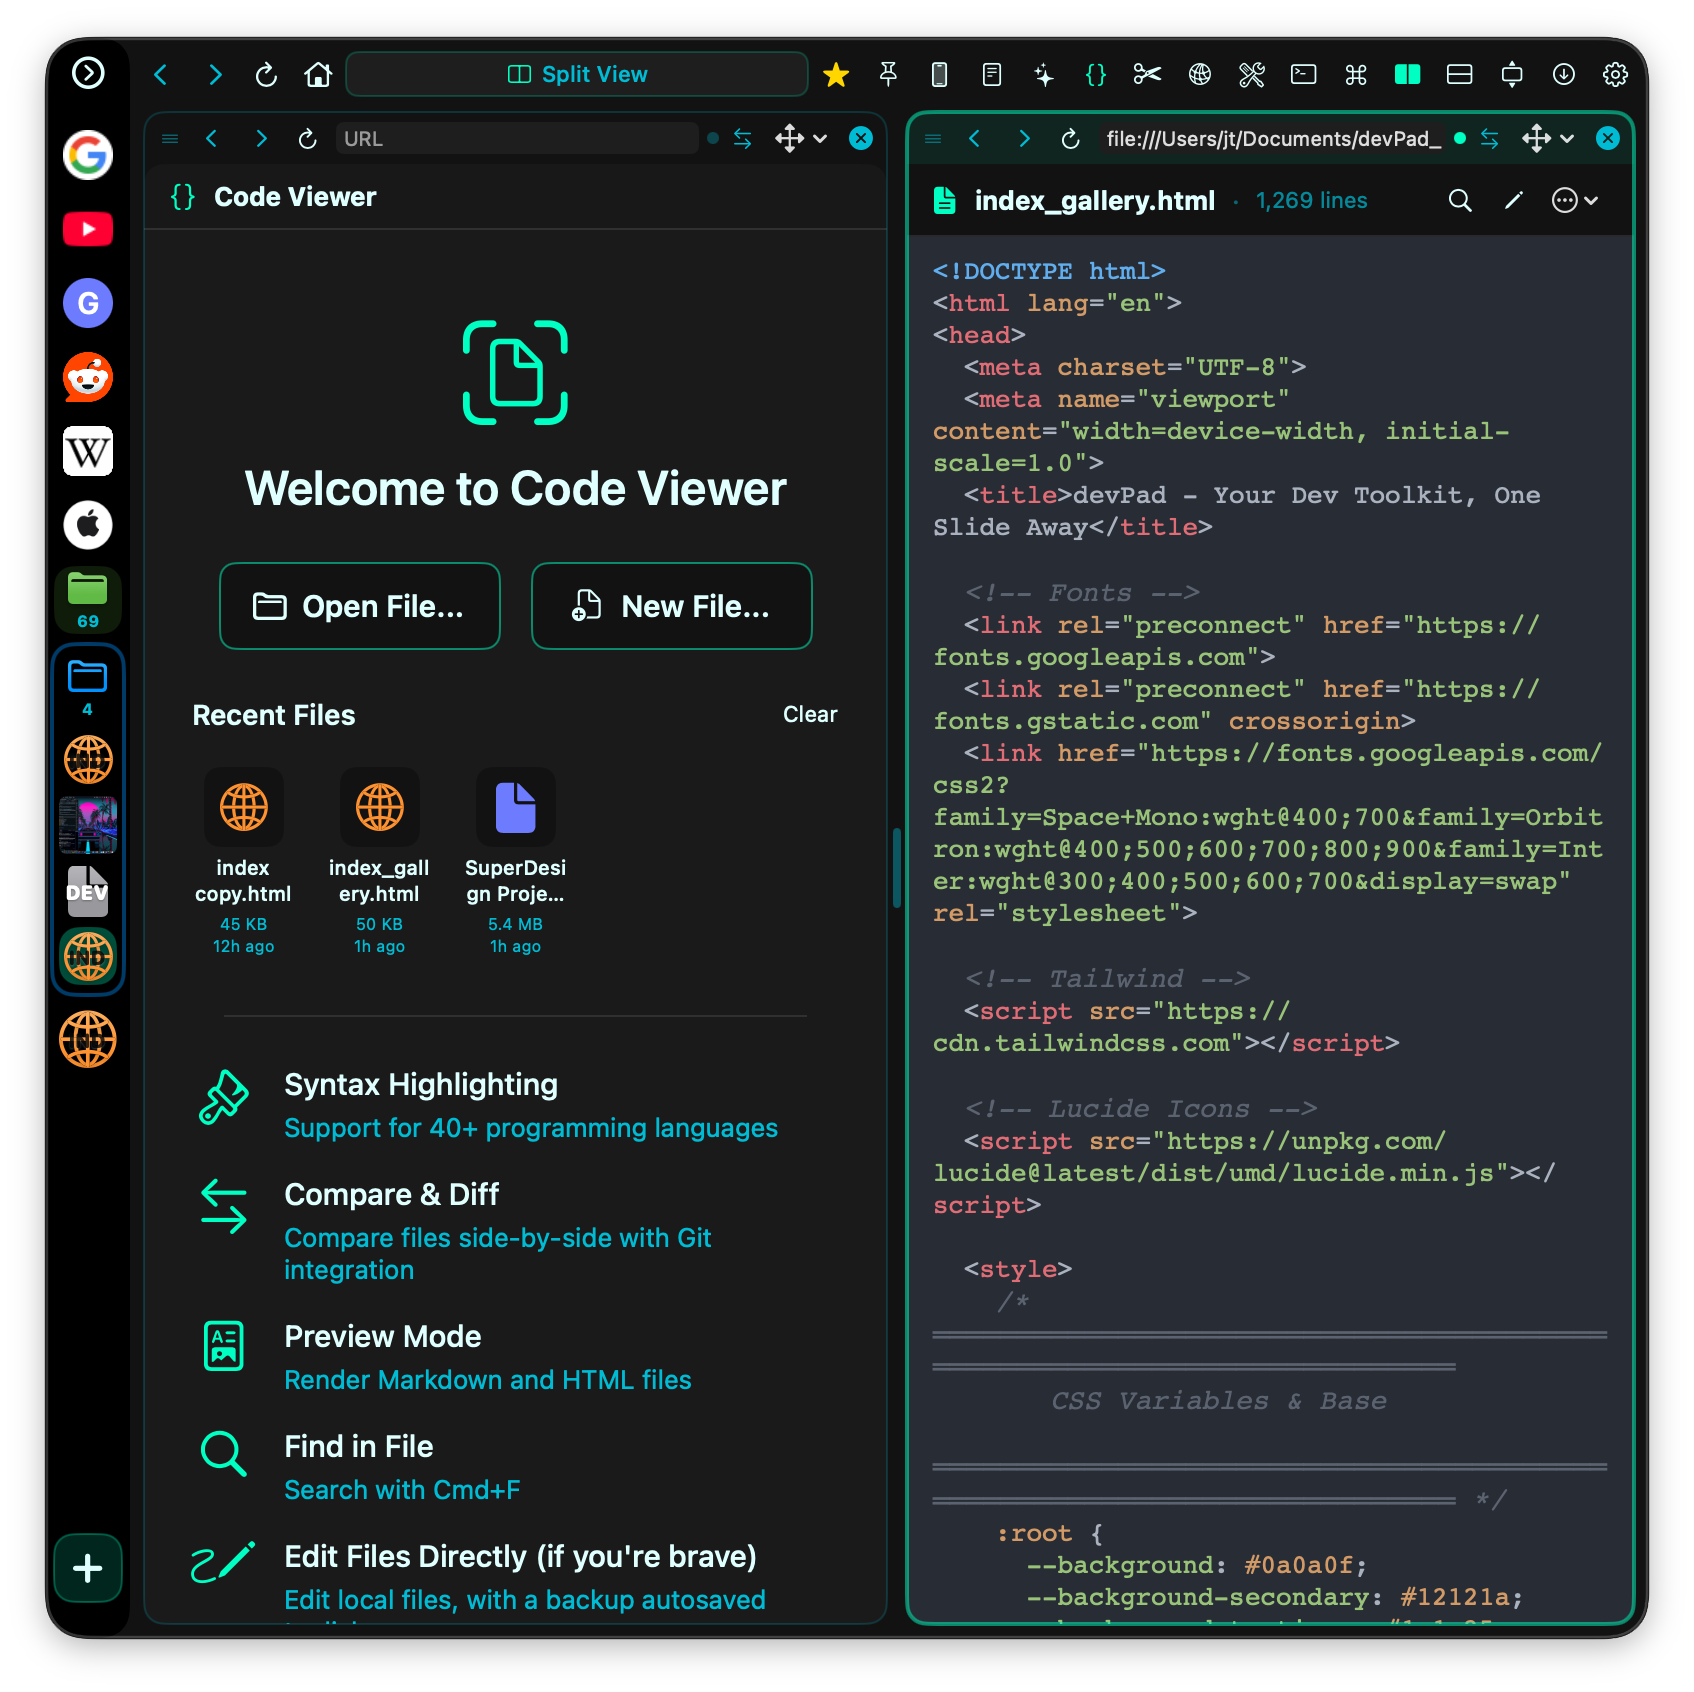
Split code files with preview modes
Search with Jump to Line
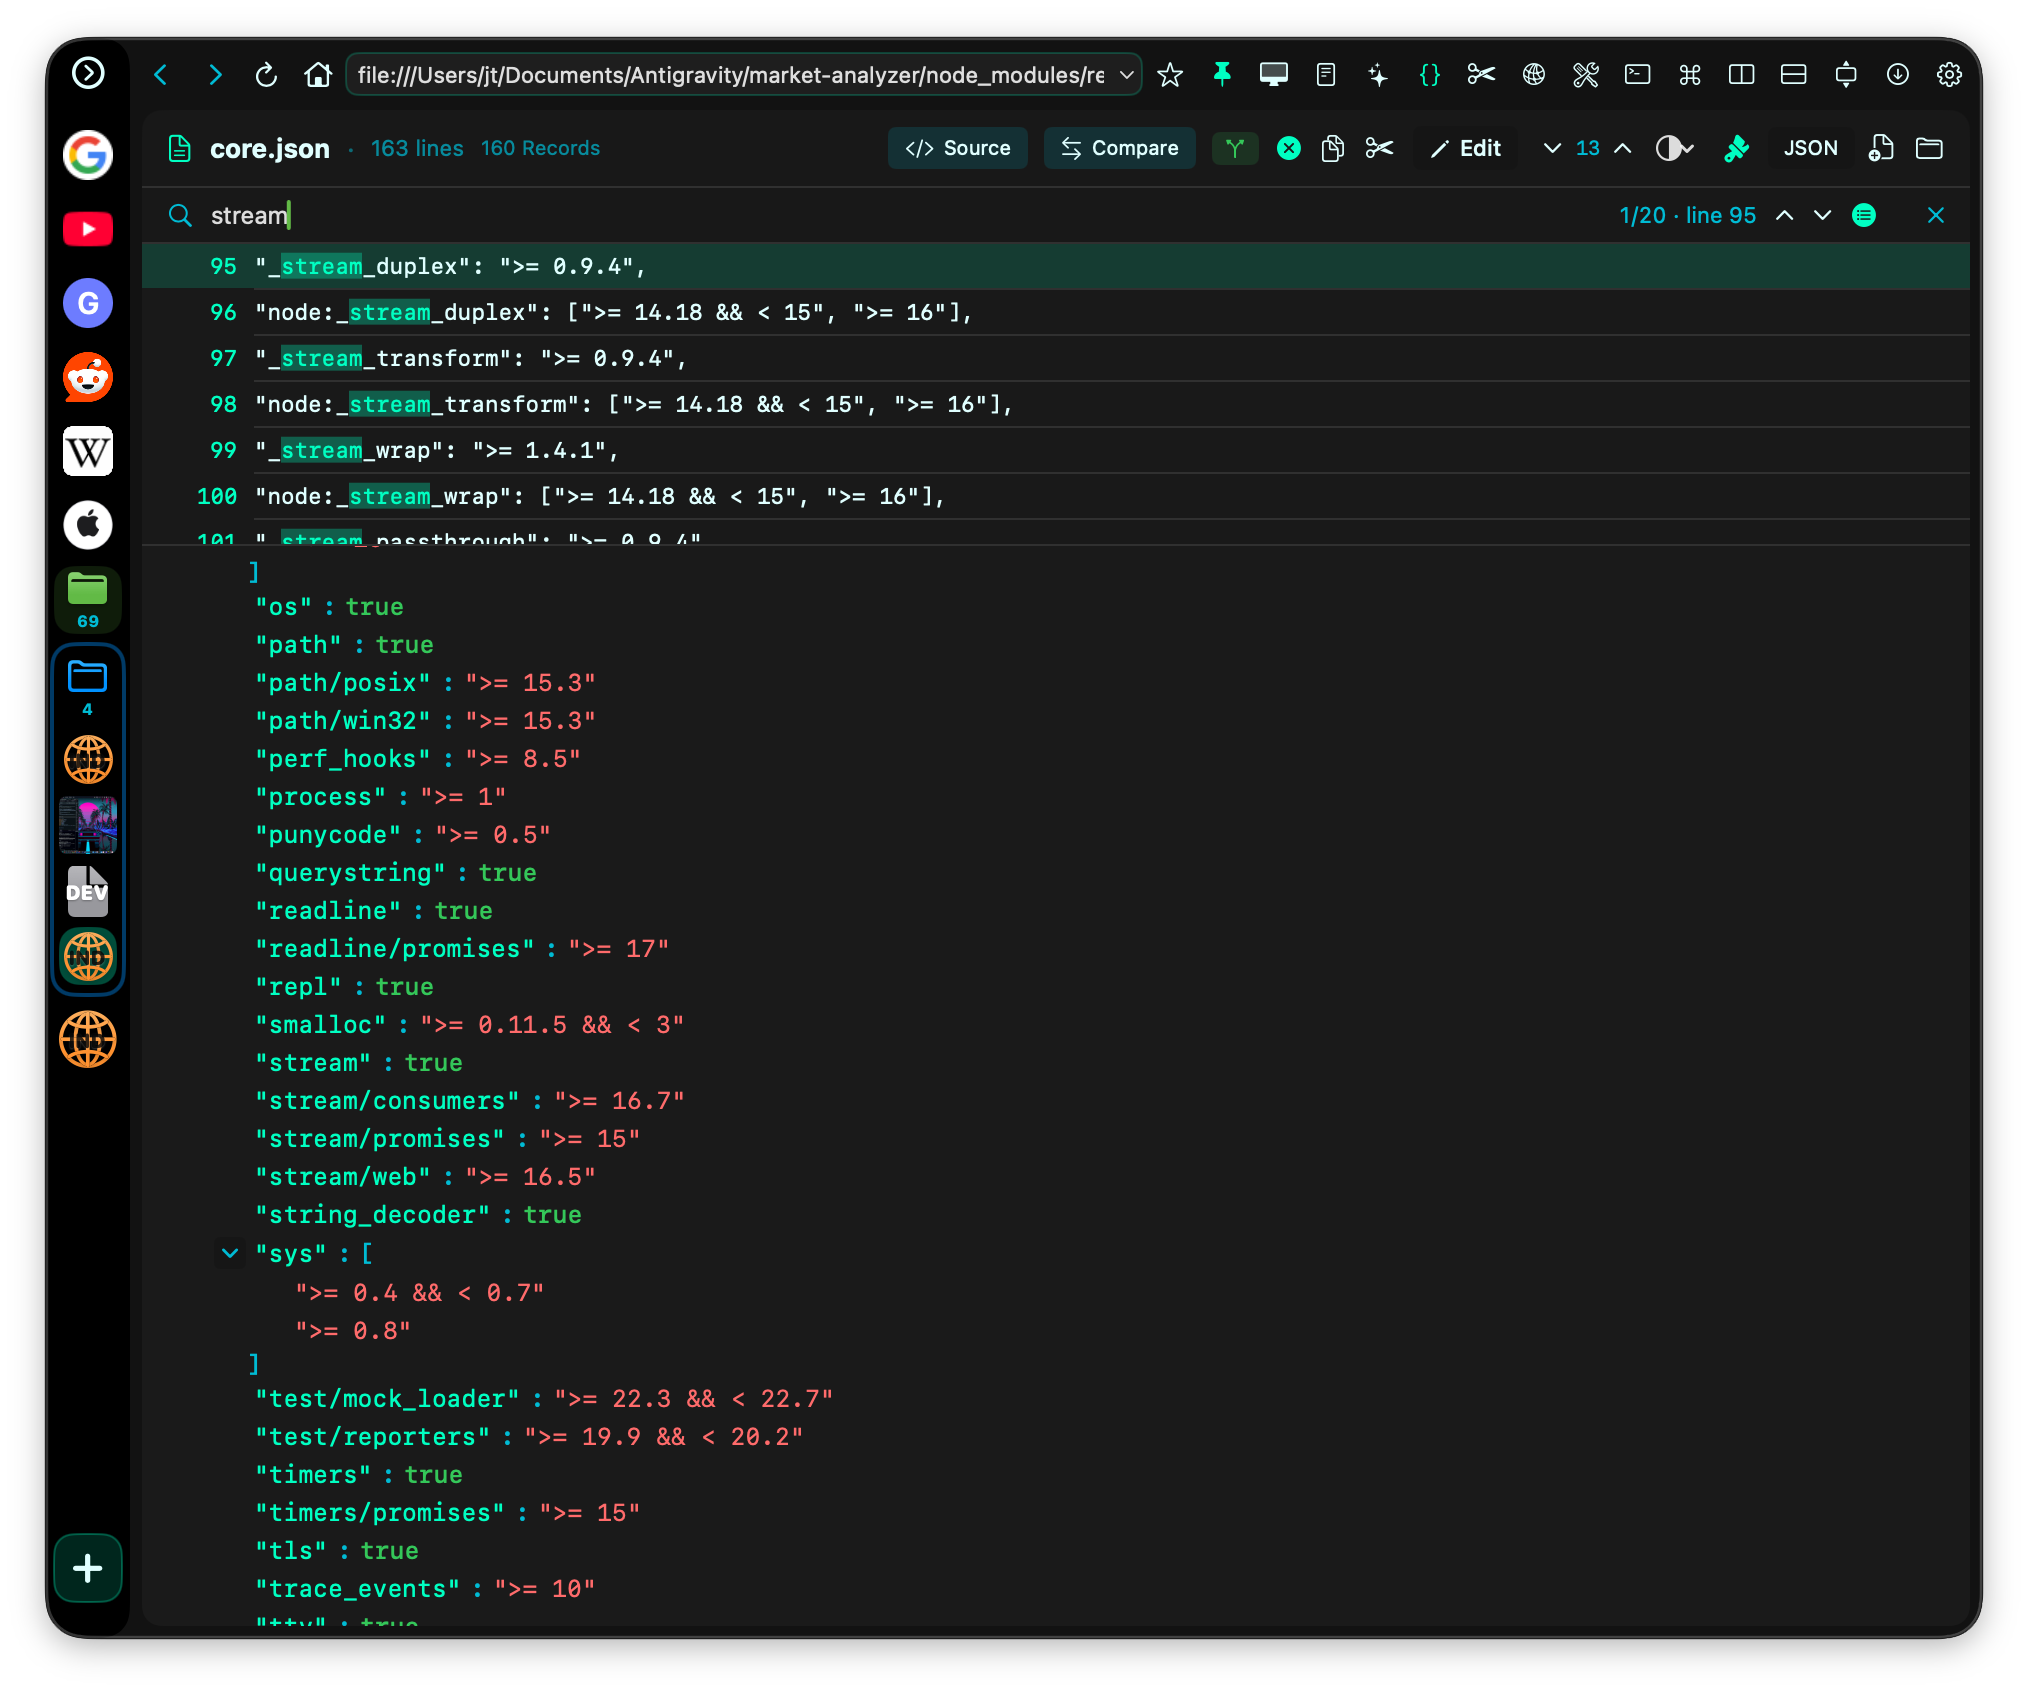
Cmd+F search with instant line navigation
Zero telemetry. No usage data, crash reports, or analytics. Your data stays on your device. Read our Privacy Policy